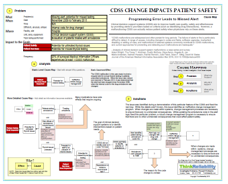
All posts by ThinkReliability Staff

ThinkReliability are specialists in applying root cause analysis to solve all types of problems. We investigate errors, defects, failures, losses, outages and incidents in a wide variety of industries. Our Cause Mapping analysis method of root causes, captures the complete investigation with the best solutions all in an easy to understand format. ThinkReliability provides investigation services and root cause analysis training to clients around the world and is considered the trusted authority on the subject.

Deadly medication error illustrates danger of discharge period

By ThinkReliability Staff

Medical errors can happen anywhere and at any time. However, these errors may be most likely to occur at transitions, especially the transition from the hospital to home when follow-up care is still required. Says Alicia Arbaje, an assistant professor at the Johns Hopkins School of Medicine, “Poor transitional care is a huge, huge issue for everybody, but especially for older people with complex needs. The most risky transition is from hospital to home with the additional need for home care services, and that’s the one we know the least about.”

The case of a woman’s death from medication errors during that transition period illustrates multiple errors that can occur during this period. We will capture the known details of this issue in a Cause Map, or root cause analysis. The first step in the Cause Mapping process is to capture the what, when, where and impacted goals in a Problem Outline. In this case, the patient passed away October 30, 2013, after discharge from a regional medical center in Missouri, where the patient was treated for congestive heart failure. Organizational goals that were impacted by the patient death (an impact to the patient safety goal), settlements with both the hospital and pharmacy (impacts to both organization’s legal/ financial goals), and the patient being administered a high dose of the wrong medication (an impact to the patient safety goal).

These impacts to the goals become “effects” of cause-and-effect relationships. The Cause Map contains all the cause-and-effect relationships that led to these impacted goals. Causes included in the map are verified with evidence, which can be provided by a variety of sources. Causes can be determined by asking “Why” questions, but more than one cause may be required to produce an effect. In this case, all necessary causes are included and joined with an “AND”.

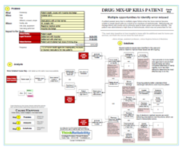
The patient safety goal was impacted because of a patient’s death due to multiple organ failure when her bone marrow became unable to create blood cells as a result of an overdose of methotrexate. Methotrexate can damage blood cell counts and is primarily used to treat cancer and severe arthritis. The patient was administered a high dose (for methotrexate) of a drug that was not prescribed for her. When the patient left the hospital, the hospital phoned an order for a daily dose of the diuretic metolazone. However, according to court evidence, the order was written down by a pharmacy technician as a daily dose of methotrexate.

Because of the side effects of methotrexate, it is included in a list of eight “high-alert” medications that warrant special safeguards to prevent incorrect dispensing. The typical dose of methotrexate is much lower, usually only once or twice a week. Despite this, the pharmacist missed the error. In a testimony, he was unable to identify a specific reason for this oversight. The pharmacy manager said “there was a breakdown in the system.”

There were more opportunities for this error to be caught before this drug was dispensed to the patient. The patient herself could have noticed the incorrect medication based on the name or information on the enclosed information sheet. However, the patient likely did not fully understand the discharge instructions. Federal data shows that less than half of patients say they’re confident they understand discharge instructions. This patient was also receiving home health care, but neither of the two nurses that saw the patient identified the medication mix-up. Even though a primary purpose of home health care is to develop and follow-up on patient care, a 2013 government report found that more than a third of facilities did not do this properly. Medicare requires that home health agencies verify patient’s medications and check for possible interaction, but inspectors found that nearly a quarter of home health agencies inadequately reviewed or tracked medications for new patients. One of the challenges is that the typical providers of post-discharge patient care (nursing homes, rehabilitation facilities and home health care providers) did not receive any of the funding provided by Congress to upgrade to electronic medical records.

Several systemic issues were identified in this case and actions meant to improve these issues are still ongoing. One reason for increased use of electronic medical records is to avoid delivering prescriptions over the phone, which can result in transcription errors. Ensuring patients better understand their discharge instructions is another goal that could improve patient safety. Lastly, improvements to home health care agencies to ensure their required tasks are being completed effectively is clearly needed, but it has been difficult to determine the most effective way to do this.

To view the Cause Map of this incident, click on “Download PDF” above. Or, click here to read more.

Programming Errors Can Impact Patient Safety

By ThinkReliability Staff

Clinical decision support systems (CDSS) aim to improve health care quality, safety and effectiveness by providing alerts to providers based on criteria (such as identifying drug interactions). However, a malfunctioning CDSS can actually reduce patient safety when physicians rely on these alerts.

According to “Analysis of clinical decision support system malfunctions: a case series and survey” by Adam Wright, et al, published March 28, 2016, “CDSS malfunctions are widespread and often persist for long periods. The failure of alerts to fire is particularly difficult to detect. A range of causes, including changes in codes and fields, software upgrades, inadvertent disabling or editing of rules, and malfunctions of external systems commonly contribute to CDSS malfunctions, and current approaches for preventing and detecting such malfunctions are inadequate.”

A survey that was part of the analysis found that 93% of Chief Medical Information Officers who responded had experienced at least one CDSS malfunction and two-thirds experienced at least an annual CDSS malfunction. Four such malfunctions were found within the CDSS system at Brigham and Women’s Hospital and were presented as case studies. We will examine one of these case studies within a Cause Map, or visual form of root cause analysis.

The first step in any root cause analysis method is to identify the problem. The CDSS malfunction in this case study involved a stopped alert for annual thyroid testing in patients prescribed amiodarone. When the issue was noticed and resolved in February 2013, it was determined that the alert had been stopped since November 2009, when the internal code for the drug amiodarone was changed.

An important step in describing the problem is to determine the organizational goals that were impacted. In this case, patient safety is impacted because of the potential for untreated thyroid issues and patient services are impacted because of the potential of missed testing.

The second step is to perform the analysis by developing the cause-and-effect relationships that led to the impacted goals. In this case, patient safety is impacted because of the potential for untreated thyroid issues. Patients may have untreated thyroid issues if they are taking amiodarone to treat arrhythmia. Amiodarone has a known side effect of thyroid issues. If staff is unaware of a patient’s thyroid issues, that patient won’t be treated. Staff would be unaware of thyroid issues in a patient if testing is not performed.

The goal of clinical decision support systems is to identify interventions based on patient needs – in this case, the hospital created an alert to suggest thyroid testing for patients who had been amiodarone and had not had a thyroid test in at least a year. Based on typical alert values from the years prior to 2009, the analysis determined that more than 9,000 alerts suggesting thyroid testing were missed.

Thyroid tests were missed because the CDSS did not identify the need for thyroid testing, and because physicians may rely on the CDSS to recommend a test like this one. The alert was originally set up to identify patients taking amiodarone (then code 40) with a start date at least 365 days ago, and no thyroid test values from within the last 365 days. In November 2009, the internal code for amiodarone changed to 7099, but the logic for the alert was not changed. (The reason for the code change is unclear.) As patient records were updated with the new code for amiodarone, the alert failed to identify them for thyroid testing.

The issue was identified during a demonstration of this particular feature of the CDSS and fixed the next day. While the details aren’t known, this issue identifies an ineffective change management program. When changes are made within systems, change management processes are necessary to ensure there are no unintended consequences. While updating the amiodarone code in the alert logic fixed this particular problem, a robust change management program is necessary to ensure that there are no other unintended consequences that could affect patient safety.

To view a visual root cause analysis of this example, please click on “Download PDF” above.

Family of Sepsis Victim Fights for Better Care

By ThinkReliability Staff

New York state has become a leader in identifying and treating sepsis. But it wasn’t always this way. On April 1, 2012, a twelve-year-old boy named Rory Staunton died from sepsis in a New York hospital (the subject of a previous blog). There were multiple opportunities that could have more quickly identified his sepsis, and potentially saved his life. After his death, Rory’s family founded the Rory Staunton Foundation For Sepsis Prevention. Part of the foundation’s mission is to improve diagnosis and treatment protocols for sepsis.

The foundation landed a success when New York state adopted what are known as “Rory’s Regulations” on December 31, 2013. These regulations require “health care providers to develop and implement protocols to rapidly diagnose and treat sepsis infections”. In addition, the state adopted hospital pediatric care regulations which specifically addressed many of the causes identified in Rory’s case. These include requirements to:

– Review of test results by a clinician familiar with the patient’s case: Blood tests ordered to be run immediately were not reviewed by the doctor who ordered them. Although initial tests showed abnormalities within an hour of Rory’s arrival, these results were not provided to the emergency department at all.

– Provide test results to the primary care provider: The test results were not provided to Rory’s primary care provider.

– Improve communications of test results to patients and parents: The test results were not provided to Rory’s parents

– Keeping patients in the hospital while awaiting critical test results: Rory had already left the hospital when the test results arrived. Because the results of the test were a matter of life or death, had his discharge been delayed while awaiting the results, the outcome may have been different.

Even with ensuring that test results make it into the right hands, diagnosing and treating sepsis is difficult. Rory’s Regulations also require developing protocols that will assist in sepsis detection and treatment. An international task force released updated definitions of sepsis and septic shock, as well as clinical guidance, in February 2016. The Centers for Medicare and Medicaid launched a new core measure for fiscal year 2016.

Another mission of the foundation is to increase public awareness and understanding of sepsis. The foundation requested the Centers for Disease Control and Prevention help them in this mission. The CDC launched its new sepsis website on May 29, 2014.

While New York’s regulations seem to have been a success (the state’s Department of Health estimates they will save at least 5,000 lives each year), the foundation isn’t stopping there. Their stated goal is to have similar regulations in place across the US by 2020.

To view the cause-and-effect relationships and the associated solutions laid out visually in a Cause Map, please click on “Download PDF” above. Click here to learn more about the Rory Staunton Foundation For Sepsis Prevention.

Questionable medical advice leads to death of old lady who swallowed a fly

By ThinkReliability Staff

There was an old lady who swallowed a fly. This was presumably accidental, but whatever the reason, it happens. Then the old lady swallowed a spider. Again, it happens. And, if you were looking for a Darwin-ish way to catch live flies, this seems to make sense. However, at that point, whether due to increasing hysteria or bad medical advice (possibly from the internet?), the old lady then proceeded to swallow progressively larger and larger animals until it led to her untimely death.

After swallowing the spider which, according to an eyewitness, wiggled and jiggled and tickled inside her, the old woman apparently felt that ingesting another animal that could catch the spider would be a good idea. So, she swallowed a bird. Now, this isn’t entirely illogical – birds do catch spiders. But the idea of ingesting a bird whole would give most of us pause. Even if it didn’t, there aren’t many types of birds that many people could easily swallow whole. Regardless, this is what the old lady did.

Continuing to move up the food chain, the logical choice of animal to catch a bird is a cat. Of course, many of us have cats as pets, and can’t imagine swallowing them, even for the purposes of catching a bird. But again, this is what the old lady did. Maybe the horror of what she had done finally got to her, because her next actions didn’t seem to answer to logic. Next, the old woman swallowed a dog. Although dogs chase cats, it’s unclear how often they “catch” them. A better choice to “catch” a cat would have probably been a cardboard box.

Then the old lady went for a goat. While goats are good for eating grass (and various other things), there’s no real evidence that goats have any desire to catch dogs. In fact, dogs are occasionally used for herding goats, so it’s unclear why the old lady would have turned to a goat next. But again, that’s what she did.

By then the delirium was apparently at an all-time high, because the old lady then swallowed a cow. It has been verified by veterinary experts that cows are not capable of catching ANYTHING, much less a goat (plus the dog and cat that are likely still running loose in there). After swallowing a cow, the old lady then gave one last ditch effort to finally wrangle all those animals she had swallowed and swallowed a horse. Beyond the obvious physical challenges involved in swallowing a horse (clearly involving an unhinged jaw and a very, very flexible throat), there are, again, moral considerations as well. But a horse does seem a better choice to wrangle a bunch of animals, although horses used for herding are generally controlled by a human rider . . from the outside. Sadly, eating a horse was too much, even for our very sturdy old lady, and that was the last thing she ever swallowed.

While the desire to catch animals already swallowed appears to be the main driving force behind the rather interesting last meal of the old lady, the question “why” is always close at hand. In particular, why did the old lady choose this particular line-up of animals? Because our best witness (the old lady) is speaking no more, we can only guess at what led to her decisions. I suspect that she came upon a nursery rhyme on the internet and confused it for advice. Which is why, any time you have a concern about something that somebody swallowed, it’s best to see or call a doctor, or poison control. (And if you swallow a fly, your stomach acid will make quick work of it, so no worries.)

Because of the risk of death involved, I propose that we place warning signs on all animals not meant to be consumed whole. The obstacles in implementing this solution are many, but when deaths of old ladies are at stake, one cannot be too safe.

To view the investigation of the old lady’s death, please click “Download PDF” above. Happy April Fools’ Day from ThinkReliability!


Death from Patient-Controlled Morphine Overdose

By ThinkReliability Staff

Could improving the reliability of the supply chain improve patient safety?

The unexpected death of a patient at a medical facility should always be investigated to determine if there are any lessons learned that could increase safety at that facility. A thorough analysis is important to determine all the lessons that can be learned. For example, the investigation into a case where a patient death was caused by a morphine overdose delivered by a patient-controlled analgesia (PCA) found that increasing the reliability of the supply chain, as well as other improvements, could increase patient safety.

The information related to this patient death was presented as a morbidity and mortality case study by the Agency for Healthcare Research and Quality. The impacts to goals, analysis, and lessons learned from the case study can be captured in a Cause Map, a visual form of root cause analysis that develops the cause-and-effect relationships in sufficient detail to be able to find solutions that will reduce the risk of similar incidents recurring.

Problem-solving methodologies such as Cause Mapping begin with defining the problem. In the Cause Mapping method, the what, when and where of the problem is captured, as well as the impact to the goals, which defines the problem. In this case, the patient safety goal is impacted due to the death of a patient. Because the death of a patient under medical care can cause healthcare providers to be second victims, this is an impact to the employee safety goal. A death associated with a medication error is a “Never Event“, which is an impact to the compliance goal. The morphine overdose is an impact to the patient services goal. In this case, the desired medication concentration (1 mg/mL morphine) was not available, which can be considered an impact to the property goal. Lastly, the response and investigation are an impact to the labor/time goal.

The analysis begins with one impacted goal and developing cause-and-effect relationships. One way to do this is by asking “Why” questions, but it’s also important to ensure that the cause listed is sufficient to have resulted in the effect. If it’s not, another cause is required, and will be joined with an “AND”. In this case, the patient death resulted from a morphine overdose AND a delayed response to the patient overdose. (If the response had come earlier, the patient might have survived.) It’s important to validate causes with evidence where possible. For example, the morphine overdose is a known cause because the autopsy found a toxic concentration of morphine. Each cause in the Cause Map then becomes an effect for which causes are captured until the Cause Map is developed to the point where effective solutions can be found.

The available information suggests that the patient was not monitored by any equipment, and that signs of deep sedation, which preceded respiratory depression, were missed during nurse checks. Related suggestions for promoting the safe use of PCA include the use of monitoring technology, such as capnography and oximetry, and assessing and recording vital signs, including depth of respiration, pain and sedation.

The patient in this case was given PCA morphine. However, too much morphine was administered. The pump settings were based on the concentration of morphine typically used (1 mg/mL).   However, that concentration was not available, so a much higher concentration (5 mg/mL) was used instead. The settings on the pump were entered incorrectly for the concentration of morphine used, likely because of confirmation bias (effectively assuming that things are the way they always are – that the morphine on the shelf will be the one that’s usually there). There was no effective double check of the order, medication and pump settings.

Related suggestions for promoting the safe use of PCA include the use of “smart” pumps, which suspend infusion when physiological parameters are breached, the use of barcoding technology for medication administration (which would have flagged the use of a different concentration), performing an independent double check, storing only one concentration of medications in a dispensing cabinet (requiring other concentrations to be specially ordered from the pharmacy), standardizing and limiting concentrations used for PCA, and yes, improving the supply chain so that it’s more likely that the lower concentration of morphine will be available. Any of these suggestions would improve patient safety; implementation of more than one solution may be required to reach an acceptable level of risk. Imagine just improving the supply chain so that there would be very few (if any) circumstances where the 1 mg/mL concentration of morphine is unavailable. Clearly the risk of using the wrong concentration would be lessened (though not zero), which would reduce the potential for patient harm.

To view a one-page downloadable PDF with the outline, Cause Map, and action items, click “Download PDF” above. Click here to read the case study.

“Desensitization” Process Improves Compatibility of Donor Kidneys

By ThinkReliability Staff

Many patients with advanced and permanent kidney failure are recommended for kidney transplants, where a donor kidney is placed into their body. Because most of us have two kidneys, donor kidneys can come from either living or deceased donors. If a compatible living donor is not found, a patient is placed on the waiting list for a deceased donor organ. Unfortunately, there are about 100,000 people on that waiting list. While waiting for a new kidney, patients must undergo dialysis, which is not only time-consuming but also expensive.

Researchers estimate that about 50,000 people on the kidney transplant waiting list have antibodies that impact their ability to find a compatible donor kidney. Of those, 20,000 are so sensitive that finding a donor kidney is “all but impossible” . . . .until now.

A study published March 9, 2016 in the New England Journal of Medicine provides promising results from a procedure that alters patients’ immune systems so they can accept previously “incompatible” donor kidneys. This procedure is called desensitization. First, antibodies are filtered out of a patient’s blood. Then the patient is given an infusion of other antibodies. The immune system then regenerates its own antibodies which are, for reasons as yet unknown, less likely to attack a donated organ. (If there’s still a concern about the remaining antibodies, the patient is treated with drugs to prevent them from making antibodies that may attack the new kidney.)

The study examined 1,025 patients with incompatible living donors at 22 medical centers and compared them to an equal number of patients on waiting lists or who received a compatible deceased donor kidney. After 8 years, 76.5% of the patients who were desensitized and received an “incompatible” living donor kidney were alive compared to only 43.9% of those who remained on the waiting list and did not receive a transplant.

The cost for desensitization is about $30,000 and a transplant costs about $100,000. However, this avoids the yearly life-long cost of $70,000 for dialysis. The procedure also takes about two weeks, so patients must have a living donor. The key is that ANY living donor will work, because the desensitization makes just about any kidney suitable, even for those patients who previously would have had significant trouble finding a compatible organ. Says Dr. Krista L. Lentin, “Desensitization may be the only realistic option for receiving a transplant.”

The study discusses only kidney transplants but there’s hope that the process will work for living-donor transplants of livers and lungs. Although the study has shown great success, the shortage of organ donations – of all kinds – is still a concern.

To view the process map for kidney failure without desensitization, and how the process map can be improved with desensitization, click on “Download PDF” above. To learn more about other methods to increase the availability of kidney donations, see our previous blog on a flushing process that can allow the use of kidneys previously considered too damaged for donation.


Patients and Insurers Pay Big for Discarded Cancer Drugs

By ThinkReliability Staff

A recent study has found that the size of vials used for cancer drugs directly results in waste, and a significant portion of the high – and steadily increasing – cost of cancer drugs.  With most cancer medications available in only one or two sizes, usually designed to provide an amount of medication for the largest patients, many times medication is left over in each vial.

The researchers estimate that about $2.8 billion is spent by Medicare and other insurers reimbursing for medication that is discarded.

This cost – paying for medication that is literally thrown out in most cases – can be considered an impact to the property goal.  As the cost increases for drugs, it’s not only Medicare and other insurers that are impacted, but patients, many of whom pay a fixed percentage of their drug costs.  This impacts the patient services goal.  The disposal of these drugs has a potential environmental impact, impacting the environmental goal.  The impacts to the goals as a result of an issue, as well as the what, when and where of that issue, are captured in a problem outline, which is the first step of the Cause Mapping process, which develops a visual diagram of the cause-and-effect relationships (a type of root cause analysis).

The second step of the process is to begin with an impacted goal and develop the cause-and-effect relationships.  This can be done by asking “why” questions and ensuring that all the causes necessary to result in an effect are included.  In some cases, more than one cause is required to produce an effect.  In these cases, the causes are both connected to the effect and joined with an “AND”.

In this case, beginning with the property goal, we can ask “Why do Medicare and other insurers have increased costs?”  This is due to the increased cost of cancer drugs, which results from significant amount of medications being thrown away.  We can add evidence to the causes to support their inclusion in the Cause Map or provide additional information.  For example, the study found that the earnings on disposed medication made up 30% of the overall sales for one cancer medication.

A significant amount of medication is being thrown away because there is medication left over in each vial used to deliver the medication, and the leftover medication in the vials is thrown away.  Both these causes are required to result in the medication waste.  Leftover medication is thrown away because it can only be used in rare circumstances (within six hours at a specialized pharmacy).  There is leftover medication in the vials because the vials hold too much medication for many patients.  (Most medication is administered based on patient weight.)  The vials hold too much medication because many medications are provided in only one or two vial sizes.  This is true of 18 of the top 20 cancer drugs.  Providing alternate vial size is not required by regulators, whose concern is limited to patient safety or potential medical errors.  Specifically, Congress has not authorized the US Food and Drug Administration (FDA) to consider cost. Drug manufacturers select vial size based on “marketing concerns” or, effectively, profit.  The study found that providing more vial sizes for one medication would reduce waste by 84% but would also reduce sales by $261 million a year.

Several of the vials for cancer medications are sized based on a larger (6’6″, 250 lb.) patient.  According to one drug manufacturer, this is done by design, resulting from working with the FDA for a vial that would provide enough medication “for a patient of almost any size.”  At least one drug manufacturer has suggested that the full vial be administered regardless of patient size, but one of the study’s co-authors says that extra medication does nothing to help patients, so it would still be wasted.

Instead, the researchers propose that the government either mandate the drugs be distributed in multiple vial sizes that would minimize waste, or that the government is refunded for wasted quantities.  They point out that alternate vial sizes are provided in Europe, “where regulators are clearly paying attention to this issue”, says Dr. Leonard Saltz, a co-author of the study.

To view the initial outline, Cause Map and proposed solutions, please click on “Download PDF” above.  Click here to view the study and drug waste calculator.

Patient death after ambulance delayed due to “extreme demand”

By ThinkReliability Staff

An inquest into the death of a young patient in London after a significant delay in the arrival of an ambulance released some disturbing details into the emergency process. We can perform a root cause analysis of the issues that led to the delay, and death, by capturing cause-and-effect relationships in a visual Cause Map.   As with many complex incidents, it will be helpful to capture the chronology of an event within a timeline. This timeline should not be confused with an analysis, but can be useful in organizing information related to the incident.

In this case, the patient, who had type 1 diabetes and had been feeling sick for more than a day, asked a friend to call an ambulance at about 5:00 pm on September 7, 2015. The friend dialed 111, which is the non-emergency medical helpline from the National Health Service. The initial call handler determined that the situation was not an emergency, but marked it for a 20-minute follow-up with a clinician. A clinical supervisor called back and spoke to the patient at 5:42 pm. She determined that it was an emergency that required an ambulance within 30 minutes. However, because it was known that the ambulance service was delayed, she asked the patient if she could get a friend to drive her to the hospital. The patient said she preferred an ambulance.

At this point it appears there was no contact until 10:15 pm, at which point a call-back was made to check on the patient’s ongoing symptoms. The friend at this time found the patient unconscious, having suffered cardiac arrest, and called 999, the emergency call system, at 10:23 pm. The ambulance arrived at 10:30 pm and took the patient to a hospital, where she died 5 days later.

At the inquest, the coroner testified that if the patient “had received definitive hospital care before she suffered a cardiac arrest in the evening of September 7, the likelihood is she would have survived.” Thus, from the perspective of the National Health Service, the patient safety goal is impacted because a death occurred that was believed to be at least partially due to an ambulance delay. Additional goals impacted are the patient services goal because of the delayed emergency treatment (the stated goal for the patient’s medical condition was 30 minutes, whereas the ambulance arrived nearly 4 hours after that goal). The schedule and operations goal is also impacted due to the insufficient capacity of both ambulances and the call system.

The Cause Mapping begins with an impacted goal and develops cause-and-effect relationships by asking “why” questions. The patient death was due to diabetic ketoacidosis, a severe complication of type 1 diabetes that may have resulted from an additional illness or underlying condition. As stated by the coroner, the delayed emergency treatment also resulted in the patient’s death. The ambulance that would take the patient to the hospital was delayed because the demand exceeded capacity. Demand was “extreme” (there were 200 other patients waiting for ambulances in London at the same time). The lack of capacity resulted from low operational resourcing, though no other information was available about what caused this. (This is a question that should be addressed by the service’s internal investigation.)

The patient was not driven to the hospital, which would potentially have gotten her treated faster and maybe even saved her life. The patient requested an ambulance and the potentially significant delay time was not discussed with the friend who had originally called. At the time of the first call-back, the estimated arrival time of an ambulance was not known. (By the time of the second call-back, it was too late.)

The second call-back was also delayed. Presumably this call was to update the patient’s symptoms as necessary and reclassify the call (to be more or less urgent) as appropriate. However, the demand exceeded supply for the call center as well as for ambulances. The call center received 300 calls during the hour of the initial call regarding this patient, which resulted in the service operations being upgraded to “purple-enhanced”. (This is the third-most serious category, the most serious being “black” or “catastrophic”.)   The change in operations meant that personnel normally assigned to call-backs were instead assigned to take initial emergency calls. Additionally, it’s likely the same “operational resourcing” issues that affected ambulance availability also impacted the call center.

Additional details of the causes related to the insufficient capacity of emergency medical services are required to come up with effective solutions. The ambulance service has completed its own internal investigation, which was presented to the family of the patient. The patient’s brother says, “I hope these lessons will be learnt and this case will not happen again” and the family says they will continue to raise awareness of the dangers of diabetes.

To view the initial analysis of this issue, including the timeline, click on “Download PDF” above. Or click here to read more.

more.

What’s the best way to screen for breast cancer? Opinions differ.

By ThinkReliability Staff

In 2015, there were 40,000 deaths from breast cancer and 232,000 new cases of breast cancer in the United States. It is the second-leading cause of cancer death in women in the United States. The very high level cause-and-effect is that people (primarily women) die from breast cancer due to ineffective treatment. The later the cancer is detected, the later the treatment begins so early detection can help prevent breast cancer deaths. Currently the best solution for detecting breast cancer is a mammogram. But the matter of when mammograms should occur is based on risk-benefit analysis.

There’s no question that mammograms save lives by detecting breast cancer. This is the benefit provided in the analysis. Lesser known are the risks of mammograms. Risks include false negatives, false positives, unnecessary biopsies, and unnecessary treatment. The radiation that may be used in treatment can actually be a cause of future breast (and other types) of cancer.

On January 11, 2016, the United States Preventive Services Task Force (USPSTF) issued an update of their guidelines on mammogram starting and ending age (as well as other related recommendations). To develop these recommendations, the task force attempted to quantify the risks and benefits of receiving mammograms at varying ages.

For women aged 40 to 49, the task force found that “there is at least moderate certainly that the net benefit is small.” The net benefit here reflects the benefits of screening (~.4 cancer deaths prevented for every 1,000 screened and an overall reduction in the risk of dying from breast cancer from ~2.7% to ~1.8%) compared to the risks of screening. Risks of mammograms every other year for women aged 40 to 49 include ~121 false positives, ~200 unnecessary biopsies, ~20 harmless cancers treated, and ~1 false negative for every 1,000 women screened. The task force determined that in this case, the benefits do not significantly outweigh the risks for the average woman. Thus, the recommendation was rated as a C, meaning “The USPSTF recommends selectively offering or providing this service to individual patients based on professional judgment and patient preferences.” (Women who are at high risk or who feel that in their individual case, the benefits outweigh the risk, may still want to get screened before age 50.)

For women aged 50 to 74, the task force found that “there is high certainty that the net benefit is moderate or there is moderate certainty that the net benefit is moderate to substantial.” The types of benefits and risks are the same as for screening women ages 40 to 49, but the benefits are greater, and the risks are less. For women aged 50 to 74, there are ~4.2 cancer deaths prevented for every 1,000 screened and an overall reduction in the risk of dying from breast cancer from 2.7% to ~1.8%.   Risks of mammograms every other year for women aged 50 to 74 include ~87 false positives, ~160 unnecessary biopsies, ~18 harmless cancers treated, and ~1.2 false negatives for every 1,000 women screened. The task force determined that for women aged 50 to 74, the benefits of mammograms every other year outweighs the risk. Thus, the recommendation was rated as a B (the USPSTF recommends the service).

The task force determined it did not have enough evidence to provide a recommendation either way for screening women over age 74.

Comparing these risks to benefits is a subjective analysis, and some do not agree with the findings. Says Dr. Clifford A. Hudis, the chief of breast cancer medicine at Memorial Sloan Kettering Cancer Center, “The harm of a missed curable cancer is something profound. The harm of an unnecessary biopsy seems somewhat less to me.” To those that disagree, the task force reiterates that personal preference should determine the age screening begins. However, insurers may choose to base coverage on these recommendations. (Currently, private insurers are required to pay for mammograms for women 40 and over through 2017.)

Determining these recommendations – like performing any risk-benefit analysis – was no easy task and demonstrates the difficulty of evaluating risks vs. benefits. Because these analyses are subjective, results may vary. To view the risk vs. benefit comparison overview by the task force, click on “Download PDF” above.

Chipotle Improves Food Safety Processes After Outbreaks

By ThinkReliability Staff

On February 8, all Chipotle stores will close in order for employees to learn how to better safeguard against food safety issues.  This is just one step of many being taken after a string of outbreaks affected Chipotle restaurants across the United States in 2015.  Three E. coli outbreaks (in Seattle in July, across 9 states in October and November, and in Kansas and Oklahoma in December) sickened more than 50 customers.  There were also 2 (unrelated) norovirus outbreaks (in California in August and Boston in December) and a salmonella outbreak in Minnesota from August through September.

In addition to customers being sickened, the impacts to the company have been severe.  The outbreaks have resulted in significant negative publicity, reducing Chipotle’s share price by at least 40% and same-store sales by 30% in December.  Food from the restaurants impacted by the fall E. coli outbreak was disposed of during voluntary closings, and the company has invested in significant testing and food safety expertise.

E. coli typically sickens restaurant customers who are served food contaminated with E. coli. Food ingredients can enter the supply chain contaminated (such as the 2011 E. coli outbreak due to contaminated sprouts), or be contaminated during preparation, either from contact with a contaminated surface or a person infected with E. coli. While testing hasn’t found any contamination on any surfaces in the affected restaurants or any employees infected with E. coli, it hasn’t been able to find any contaminated food products either. While this is not uncommon (the source for the listeria outbreak that resulted in the recall of ice cream products has not yet been definitively determined), it does require more extensive solutions to ensure that any potential sources of contamination are eliminated.

Performing an investigation with potential, rather than known causes, can still lead to solutions that will reduce the risk of a similar incident recurring.  Potential or known causes can be determined with the use of a Cause Map, a visual form of root cause analysis.  To create a Cause Map, begin with an impacted goal and ask “Why” questions to determine cause-and-effect relationships.  In this case, the safety goal was impacted because people got sick from an E. coli outbreak.  A contaminated ingredient was served to customers.  This means the ingredient either entered the supply chain contaminated or it was contaminated during preparation, as discussed above.  In order for a contaminated ingredient to enter the supply chain, it has to be contaminated with E. coli, and not be tested for E. coli.  Testing all raw ingredients isn’t practical.

Chipotle is instituting solutions that will address all potential causes of the outbreak.  Weekly and quarterly audits, as well as external assessments will increase oversight.  Cilantro will be added to hot rice to decrease the presence of microbes.  The all-employee meeting on February 8 will cover food safety, including new sanitation procedures that will be used going forward.  The supply chain department is working with suppliers to increase sampling and testing of ingredients.  Certain raw ingredients that are difficult to test individually (such as tomatoes) will be washed, diced, and then tested in a centralized prep kitchen and shipped to individual restaurants.  Other fresh produce items delivered to restaurants (like onions) will be blanched (submerged in boiling water for 3-5 seconds) for sanitation prior to being prepared.

Chipotle has released a statement describing their efforts: “In the wake of recent food safety-related incidents at a number of Chipotle restaurants, we have taken aggressive actions to implement pioneering food safety practices. We have carefully examined our operations—from the farms that produce our ingredients, to the partners that deliver them to our restaurants, to the cooking techniques used by our restaurant crews—and determined the steps necessary to make the food served at Chipotle as safe as possible.”  It is hoped that the actions being implemented will result in the delivery of safe food, with no outbreaks, in 2016.

To view the impacts to the goals, timeline of outbreaks, analysis, and solutions, please click on “Download PDF” above.  Or click here to learn more.