Category Archives: Root Cause Analysis

Consumers outraged by EpiPen price increases

By ThinkReliability Staff

Outrage over rampant increases in drug prices is nothing new. But it seems to have reached a new high with the rising cost of the EpiPen, an auto-injection device that delivers epinephrine to severe allergy sufferers who are at risk of their throat closing shut due to anaphylaxis. Disgust with the increase is at such levels that Martin Shkreli, the CEO of Turing, who, in 2015, raised the price of Daraprim, a malaria-HIV drug 5,000% (from $13.50 to $750 a tablet) has asked “What drives this company’s moral compass?” and referred to Mylan (the manufacturer of the EpiPen®) as “vultures”. (See our previous blog on the price increase of Daraprim.)

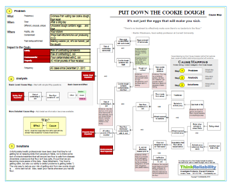
The EpiPen has been in use since 1977 (so research and development costs have long since been recouped). It was bought by Mylan in 2007, when the cost of an EpiPen was less than $60 and revenue from the product was about $2 million a year, with a profit margin of 9%.   Fast forward to 2016, when the cost of an EpiPen 2-pack (the only way they are sold) is more than $600, with a profit margin of 55%. Last year, the revenue from EpiPen was $1.2 billion, accounting for 40% of Mylan’s profits. Over that time, the compensation for Mylan’s CEO increased from $2.5 million to $18.9 million. Profits are rising rapidly along with the EpiPen costs.   (As a comparison, the cost of two EpiPens in France is about $85.)

The US Senate has demanded information related to the cost increase. It’s not based on the cost of raw materials (the amount of epinephrine in an EpiPen costs less than a dollar).   Mylan claims that it’s due to an improved product, but provides no specifics, and there doesn’t appear to be anything noticeably different to users. Many claim that the price increase is simply because Mylan can. Senator Amy Klobuchar, the ranking member of the Senate Judiciary Committee, says “This outrageous increase in the price of EpiPens is occurring at the same time that Mylan Pharmaceutical is exploiting a monopoly market advantage that has fallen into its lap.”

Mylan currently has an effective monopoly on the EpiPen. There is no generic alternative.   EpiPen has a monopoly in the US via patent until 2025. Another manufacturer’s application to the US Food and Drug Administration (FDA) was rejected for “major deficiencies”. It does not expect its product to be brought to market until 2017 at the earliest. Three alternatives to the EpiPen have been removed from the market since 2012 although one, Adrenaclick, is back on the market. However, Adrenaclick is not considered pharmaceutically equivalent, so it has to be prescribed by a doctor, which is unlikely due to the name recognition of EpiPen (thanks to its massive marketing campaign and free giveaways). It’s also considered more difficult to use, somewhat expensive on its own, and not covered by many insurance plans.

Mylan says that “In 2015, nearly 80% of commercially insured patients using the My EpiPen Savings Card received EpiPen Auto-Injector for $0.” That leaves nearly 20% of insured patients (and nearly all uninsured patients) paying out-of-pocket costs that have been reported at more than $1,000 for a two-pack (the only way EpiPens are currently sold – many times two doses are needed). To add insult to injury, an EpiPen is usually good for a year or less because epinephrine is extremely unstable and a full dose is needed in the case of a reaction.

Unfortunately, there aren’t many good alternatives to paying for the EpiPen. Going without, or using an expired EpiPen, could be extremely dangerous. While epinephrine can be injected via a normal syringe without the EpiPen functionality, that in itself carries risk and should only be performed by a trained professional. (Many governments are providing epinephrine, syringes and training to emergency medical responders to avoid the cost of multiple EpiPens.)

Most of the general public will just have to wait: for a generic to be introduced, for Adrenaclick to be covered by insurance, or for the Senate to quash the price gouging.

To view a one-page PDF showing the cause-and-effect relationships associated with the EpiPen price increases, click “Download PDF” above. Or, click here to read more.

Put down the cookie dough

By ThinkReliability Staff

Almost everybody knows that there are potential risks with eating raw cookie dough (or any other raw batter).  However, much of that risk was thought to be due to the potential of salmonella from raw eggs and so, if the plan was to eat, rather than cook, the dough, the eggs could just be left out.  No more! say health experts.  Turns out that just removing the eggs and eating the raw dough may protect you from salmonella, but it still leaves you at risk for E. coli.

A Cause Map, or visual form of root cause analysis, can help demonstrate the risks (or potential impacts) associated with an issue, as well as the causes that lead to those risks.  The process begins by capturing the what, when and where of an incident, as well as the impact to the goals in an Outline.  In this case, the problems being addressed are risk of illness from eating raw cookie dough, as well as a recall associated with contaminated flour.  The when and where are just about everywhere that dough or batter is being made (or eaten).  The safety risks most commonly associated with eating raw cookie dough are salmonella and now E. coli.  The environmental goal is impacted because flour is contaminated with E. coli and the property goal is impacted because of 45 million pounds of flour that have been recalled by the current recall.

Once the impacted goals are captured, they become the first “effects” in the cause-and-effect relationships.  The Cause Map is created by capturing all the causes that led to an effect.  In this case, the risk of contracting salmonella from eating raw cookie dough results from eggs being exposed to salmonella, and the salmonella not being effectively destroyed (by the heat of baking).  The risk of contracting E. coli results from a similar issue.

Cookie dough contains raw flour.  The cooking process kills E. coli (as well as salmonella), meaning cookies and other baked goods are safe to eat, but dough is not.  Distributed raw (uncooked) flour was found to be contaminated with E. coli (leading to the impacted environmental goal and the recall).  The flour was likely contaminated with E. coli while it was still wheat in the field.  Birds and other animals do their business just about wherever they want, and it’s got some bacteria in it, meaning that excrement that falls on wheat fields can deliver contamination to pre-flour.  (Quick side note: we frequently get asked when to stop asking “why” questions.  When you get to an answer that is completely outside your control, like why birds poop in wheat fields, for example, this is a good place to end the cause-and-effect reasoning.)

While flour is processed, the process isn’t designed to completely kill pathogens (unlike pasteurization, for example) and according to Martin Wiedmann, food safety professor at Cornell University, “There’s no treatment to effectively make sure there’s no bacteria in the flour.”  Flour is not designed to be a ready-to-eat product.

Once the causes related to an issue have been developed, the next step is to brainstorm and select solutions.  Unfortunately, health professionals have been clear that they’re not getting far on keeping birds from pooping in fields, nor is there some sort of miracle treatment that will ensure raw flour is safe from disease.  (Scientists underscore that flour isn’t less safe, it’s just that we are becoming more aware of the risks.  Says Wiedmann, “Our food is getting safer, but also our ability to detect problems is getting better.”)  The only way to reduce your risk of getting sick from raw cookie dough is . . . not to eat it at all.  Also, wash your hands whenever you handle flour. (This is of course after you’ve thrown out the floor involved in the recall, which you can find by clicking here.)

To view the Cause Map of the problems associated with raw cookie dough, please click on “Download PDF” above.

Patient receives double dose of radiotherapy

By ThinkReliability Staff

The risk associated with medical treatment administration is high. There is a high probability for errors because of the complexity of the process involved in not only choosing a treatment, but ensuring that the amount and rate of treatment is appropriately calculated for the patient. The consequence associated with treatment errors is significant – death can and does result from inappropriately administered treatment.

Medical treatment includes delivery of both medication and radiation. Because of the high risk associated with administering both medication and radiation therapy, independent checks are frequently used to reduce risk.

Independent checks work in the following way: one trained healthcare worker performs the calculation associated with medical treatment delivery. If the treatment is then delivered to the patient, the probability that a patient will receive incorrect treatment is the error rate of that healthcare worker. (For example, a typical error rate for highly trained personnel is 1/1,000. If only one worker is involved with the process, there is a 0.1% chance the patient will receive incorrect treatment.) With an independent check, a second trained worker performs the same calculations, and the results are compared. If the results match, the medication is administered. If they don’t, a secondary process is implemented. The probability of a patient receiving incorrect treatment is then the product of both error rates. (If the second worker also has an error rate of 1/1,000, the probability that both workers will make an error on the same independently performed calculation is 1/1,000 x 1/1,000, or 0.0001%.)

However, in a case last year in Scotland, a patient received a significant radiotherapy overdose despite the use of independent checks, and verification by computer.   In order to better understand how the error occurred, we can visually diagram the cause-and-effect relationships in a Cause Map. The error in this case is an impact to the patient safety goal, as a radiotherapy overdose carries a significant possibility of serious harm. The Cause Map is built by starting at an impacted goal and asking “why” questions. All causes that result in an effect should be included on the Cause Map.

In this case, the radiotherapy overdose occurred because the patient was receiving palliative radiotherapy, the incorrect dose was entered into the treatment plan, and the incorrect dose was not caught by verification methods. Each of these causes is also an effect, and continuing to ask “Why” questions will develop more cause-and-effect relationships. The incorrect dose was entered into the treatment plan because it was calculated incorrectly (but the same) by two different radiographers working independently. Both radiographers made the same error in their manual calculations. This particular radiotherapy program involved two beams (whereas one beam is more common). The dose for each beam then must be divided by two (to ensure the overall dose is as ordered). This division was not performed, leading to a doubled calculated dose. The inquiry into the overdose found that both radiographers used an old procedure which was confusing and not recommended by the manufacturer of the software that controlled the radiotherapy delivery. While a new procedure had been implemented in February 2015, the radiographers had not been trained in the new procedure.

Once the two manual calculations are performed, the treatment plan (including the dose) was entered into the computer (by a third radiographer). If the treatment plan does not match the computer’s calculations, the computer sends an alert and registers an error. The treatment plan cannot be delivered to the patient until this error is cleared. The facility’s process at this point involves bringing in a treatment planner to attempt to match the computer and calculated doses. In this case, the treatment planner was one of the radiographers who had first (incorrectly) performed the dose calculation. The radiographers involved testified that alerts came up frequently, and that any click would remove them from the screen (so sometimes they were missed altogether).

The inquiry found that somehow the computer settings were changed to make the computer agree with the (incorrect) manual calculations, essentially performing an error override. The inquiry found that the radiographers involved in the case believed that the manually calculated dose was correct, likely because they didn’t understand how the computer calculated doses (not having had any training on its use) and held a general belief that the computer didn’t work well for calculating two beams.

As a result of this incident, the inquiry made several recommendations for the treatment plan process to avoid this type of error from recurring. Specifically, the inquiry recommended that the procedure and training for manual calculation be improved, independent verification be performed using a different method, procedures for use of the computer be improved (including required training on its use), and requiring manual calculations to be redone when not in agreement with the computer. All of these solutions will reduce the risk of the error occurring.

There is also a recommended solution that doesn’t reduce the risk of having an error, but increases the probability of it being caught quickly. This is to outfit patients receiving radiotherapy with a dosimeter so their received dose can be compared with the ordered dose. (In this case, the patient received 5 treatments; had a dosimeter been used and checked the error would likely have been noticed after only one.)

To view the Cause Map for this incident, please click on “Download PDF” above.

CDC provides guidance for states to respond to Zika cases

By ThinkReliability Staff

The first Zika cases related to the current outbreak were found in Brazil in May 2015, along with a dramatic increase in microcephaly in babies born in that year. (See our previous blog about the possible link – now verified – between Zika and microcephaly.) Microcephaly is a serious birth defect that impacts many children whose mothers contract Zika while pregnant.

Active Zika transmission currently exists in nearly all of South and Central America, the Caribbean, and some Pacific Islands. 934 people in the US have been infected with Zika; 287 of those infected are pregnant women. Most of these people were infected outside the country and then traveled to the US. Zika is primarily spread by mosquitos, but can also be transmitted through blood transfusion, laboratory exposure and sexual contact.

While no cases of transmission by mosquito have yet been reported in the continental US, the Centers for Disease Control and Prevention (CDC) has released a blueprint for states to respond to locally transmitted cases of Zika. A visual diagram outlining the steps to be taken from the blueprint (a Process Map) can be helpful. (To view the Process Map for the CDC’s interim Zika response process, click on “Download PDF”.)

The CDC’s plan involves four stages. The first stage is implemented during mosquito season. This stage involves surveillance for suspected locally transmitted infections (i.e. persons with “symptoms compatible with Zika virus infection who do not have risk factors for acquisition through travel or sexual contact”, with pending test results). Upon a suspected infection, state officials and the CDC should be notified. State or local officials will open an epidemiological investigation (including ongoing surveillance) and begin implementing controls, involving both reducing mosquito populations and continuing public outreach, with CDC assistance as needed.

Stage 2 occurs upon confirmation of a locally transmitted infection. At this point, notification expands to include local blood centers as well as others required by International Health Regulations. The CDC will assist with an expanded investigation, surveillance, and communication, including deployment of an emergency response team (CERT) if desired. Once Stage 2 has been reached, stand down will only occur after 45 days (3 mosquito incubation periods) without additional infections or when environmental conditions no longer permit transmission.

If there is confirmed Zika in two or more persons whose movement during the exposure period overlaps within a one-mile diameter, Stage 3 (widespread local transmission) is entered. First, local officials will attempt to determine the transmission area, the “geographic area in which multiperson local transmission has occurred and may be ongoing”. Communication, surveillance, testing and controls are enhanced and expanded. Interventions for blood safety and vulnerable populations (including pregnant women) are implemented.

Once the infection has spread outside a county, it enters Stage 4 (widespread multijurisdictional transmission). All steps taken in previous stages are expanded and enhanced. The CDC will evaluate whether local capacity is adequate for response, and will assist as needed. Stage 4 actions will be continued until the criteria for stand down is met.

Based on previous experience with two mosquito-transmitted diseases, chikungunya & dengue fever, the CDC does not believe Stage 4 will be reached within the United States. However, as Dr. Tim F. Jones, an epidemiologist for the State of Tennessee, says, “Even though the percentages and the likelihoods are incredibly low, the outcome is awful.” Risk is a function of probability and consequence. Even with a low probability, the high consequence makes the risk from Zika considerable, and worth planning for.

To view the Process Map, click on “Download PDF” above. Or, click here to view the CDC’s interim guidance.

.

It’s Faster to Send a Rescue Mission to the International Space Station Than to the South Pole

By ThinkReliability Staff

Yes, you read that correctly. Says Ron Shemenski, a former physician for the station, “We were stuck in a place that’s harder to get to than the International Space Station. We know we’re on our own.” A sick astronaut on the International Space Station can jump in the return vehicle permanently parked at the station and make it back to earth in about 3.5 hours. In contrast, just to get a plane to the Amundsen-Scott South Pole research station takes 5 days – in good weather. Which is not at all the situation right now – at the South Pole it’s the very middle of winter.

This makes for an incredibly risky evacuation. It’s so risky that the scientists at the station expect to stay there from February to October, no matter what. The on-site physician biopsied and administered chemotherapy to herself in 1999. A scientist who suffered a stroke in 2011 had to wait until the next scheduled flight. However, winter medical evacuations have been performed twice before in the history of the station (since 1957), in April 2001 and September 2003. These two evacuations were performed by the same company that will perform this rescue. On June 14, the National Science Foundation (who runs the station) approved the medical evacuation of a scientist there. Two flights left Calgary, Canada that same day.

What makes the evacuation so risky that there is a debate over whether or not to rescue an ailing scientist? There are multiple factors that are considered in the decision. These issues can be developed within a cause-and-effect diagram, presented as a Cause Map. The first step in the process is to determine the impacts to the goals that result from a problem. In this case, we will look at the problem of a scientist at the South Pole becoming ill and requiring evacuation. There is an impact to the patient safety goal due to the delay of medical treatment. There’s also an impact to the safety of the aircrew on the flights used to rescue the scientist. There’s also an impact to property/ equipment and labor/ time due to the risky, complex evacuation process.

In the analysis (the second step of the process), the impacted goals become the effect in the first cause-and-effect relationships. The delay in medical treatment for the patient (the ailing scientist) results because required treatment is not available at the station, although a physician and physician’s assistant staff the clinic throughout the winter. There’s also a delay for the decision to send an evacuation plane. In this case, a day and a half of deliberation were required. As previously discussed, normally planes do not arrive at the station during the winter. It’s happened only twice previously in the last nearly 60 years. In order to ensure safety, the crew at the station undergoes a rigorous medical screening, to prevent illnesses requiring evacuation as much as possible.

Medical treatment is also delayed by the time required for the plane to arrive at the South Pole, and then for the plane to return the patient to a medical treatment center. (Which center is determined by the nature of the medical issue, which has not been disclosed, but the nearest centers are thousands of miles away.) The trip to the South Pole takes at least 5 days because of the complexity of the process. It also poses a risk to the air crews making the trip. (There are two planes sent in; one for evacuation and one to remain nearby in a search-and-rescue capability.)

The conditions in Antarctica are the cause of many of the difficulties. The sun set at the station in March, and will not rise again until September, so the plane must land without any daylight. It also has to land on packed snow/ ice, which requires skis, as there are no paved runways and the average winter temperature is -76°F (with wind chill it feels like -114°F). At those temperatures, most jet fuel freezes, so only certain planes can make the trip. (This is why they’re coming from Canada.) The planes can only hold 12-13 hours of fuel, and the last leg of the trip (across Antarctica) takes 10 hours (again, in good weather) so after a few hours into the flight, the plane has to either turn back, or they must land at the South Pole, regardless of conditions. Due to the desolation of the area, there’s nowhere else to land or refuel.

Currently one plane has made it to the South Pole, where it will wait for at least ten hours to allow the flight crew to rest and monitor the weather. The second plane remains at the Rothera Research Station, on Adelaide Island on the edge of Antarctica. Check for updates by clicking here. View the one-page downloadable Cause Map by clicking “Download PDF” above.


Government advisory group provides recommendations to help those with hearing loss

By ThinkReliability Staff

Controversial recommendations from a government advisory group studying hearing treatment call for hearing aids to be treated more like glasses. In order to understand why these recommendations were made, we’ll look at the problem of untreated hearing loss in a Cause Map, a visual diagram of cause-and-effect relationships that create a root cause analysis.

The first step in any problem solving method is to determine the problem. In this case, it’s untreated hearing loss. Using the Cause Mapping method, we’ll go a step further and document the impacts to the goals as a result of the problem. Untreated hearing loss impacts the public safety goal in several ways: it can lead to social isolation, depression, cognitive dysfunction, and dementia. The patient service goal is impacted because patients are unable to hear properly. The financial goal is also impacted because of the out-of-pocket expense of many hearing aids.

The next step is to analyze the issue by capturing the cause-and-effect relationships. We do this by beginning with one of the impacted goals. Cognitive dysfunction and dementia have been found to result from hearing loss because of the additional strain on the brain while it attempts to understand garbled sound in patients that are unable to hear properly. Additionally, reduced auditory input may cause parts of the brain to shrink. We can add in the other impacted goals as appropriate. Social isolation and depression result from the inability to fully participate in activities due to being unable to hear properly. This itself is an impact to the goals.

Patients are unable to hear properly when they suffer from hearing loss and they are not using hearing aids. About 30 million Americans suffer from hearing loss. In many cases, this is an effect of aging, but the causes of hearing loss were not discussed in detail by the advisory group. The group found that only a small number of those Americans suffering from hearing loss actually used hearing aids.

Some patients are unaware they are suffering from hearing loss. Hearing evaluations are not part of routine checkups, including annual Medicare wellness visits. For patients who know of their hearing loss, the out-of-pocket expense of hearing aids may be keeping them from treating it. The cost of hearing aids and fitting services average about $4,700. Insurance reimbursement is limited and while Medicare covers diagnostic hearing tests, it doesn’t pay for hearing aids. Patients’ abilities to shop around or switch providers can be limited. In many cases, patients don’t have access to their hearing tests and are unable to give their test results to a different provider from the one who performed the diagnostic testing. Hearing devices and services are often bundled, making it difficult to compare costs and some devices can only be programmed by certain providers, limiting access and increasing costs of servicing.

The advisory group has recommended that hearing aids be sold more like eyeglasses: the results of a hearing test given to a patient, who can then choose to get a prescription hearing aid from the provider of their choice or an over-the-counter wearable for mild hearing problems. (There are various products like this ranging in price from $50 to $500 but the FDA doesn’t consider them hearing treatments.) This would require action by both the FDA and hearing evaluation providers.

The group also recommends hearing aid providers itemize invoices and disclose if the aids can only be programmed by certain providers. Additional recommendations are for Medicare and other insurance providers to evaluate coverage of hearing aids and related care, and for the scientific/ medical community to perform more research into the physical health effects of hearing loss.

To view the impacted goals, Cause Map including cause-and-effect relationships, and solution recommendations related to untreated hearing loss, please click “Download PDF” above.

Millions of sippy cups recalled

By Kim Smiley

On May 27, 2016, it was announced that 3.1 million Tommee Tippee Sippee spill-proof cups were being recalled because of concerns about mold. The issue came to light after consumers called the company to complain about finding mold in children’s cups and several alarming photos of moldy cup valves were posted on the company’s Facebook page, some shared thousands of times. There have been more than three thousand consumer reports about mold forming in the cup valves, including 68 cases of illness that are consistent with consuming mold.

A Cause Map, a visual root cause analysis, can be built to better understand this issue. The first step in the Cause Mapping process is to fill in an Outline with the basic background information, including how the issue impacts the overall goals. In this case, the safety goal is impacted because 68 cases of illness have been reported. The regulatory call is impacted by the recall of the cups and the economic goal is impacted because of the high cost associated with recalling and replacing millions of cups. The time required to investigate and address the issue can be considered an impact to the labor/time goal. Additionally, the customer service goal is impacted because more than 3,000 consumers have reported mold in their sippy cups and because of the negative social media.

The next step in the Cause Mapping process is to build the Cause Map itself. The Cause Map is built by asking “why” questions and visually laying out the answers to show the cause-and-effect relationships. Understanding the many causes that contribute to an issue can help a broader range of solutions to be considered rather than focusing on a single “root cause” and focusing on solving only one issue. In this example, the mold is growing in the one-piece valve used in this model of cup. The valves remained moist, likely because they are not allowed to dry between uses, and they were not cleaned frequently enough to prevent mold growth. Many consumers have complained that it is very difficult or even impossible to adequately clean the cup valve which has contributed to the mold issue. In addition to the growth of the mold, one of the reasons children have gotten is sick is because it is hard to see the mold. Caregivers are unaware of the fact that the cups are moldy and continue to use them. (To see how these issue might be captured on a Cause Map, click on “Download PDF” above.)

The final step in the Cause Mapping process is to develop and implement solutions that will reduce the risk of the problem from reoccurring. In this case, all cup designs that use the single one-piece valve are being recalled and the valve replaced with either a trainer straw cup with no valve or a sippy cup with a new design two-piece valve that is easier to clean. The new two-piece valve comes apart in such a way that should also make it much easier to identify a potential mold issue, which should hopefully reduce the likelihood that a child will ingest mold. (If you think you may own one of these cups, you can get more information about how to get a replacement here.)

One of the interesting pieces of this case study is that the company has to work to address the technical issue with the valve design, but it also has to work to rebuild consumer trust. Consumers, especially when buying products for small children, will avoid a company if they don’t believe they take safety concerns seriously. This company has taken a beating online by outraged parents in the months leading up to the recall. In addition to designing a valve that will be less likely to harbor mold, it benefited the company to ensure the new design made it easy for parents to see that the cup valve was mold-free and safe. The company has also worked to spread information about the recall and tried to make it easy for consumers to get their recalled cups replaced. How a recall is handled has a huge impact on how consumers respond to the issue. A recall that isn’t handled well on top of an issue that has already shaken consumer trust can quickly spell disaster for a company. Consumers can be much more forgiving of an issue if a company responds quickly and if any necessary recalls are done as quickly and effectively as possible. It will be interesting to see how this company weathers this storm now that the cups have been recalled and the mold issue addressed.

Particulate Matter Closes Operating Rooms at VA Hospital

By ThinkReliability Staff

On February 17, 2016, the 5 operating rooms at a New York Veterans Affairs (VA) hospital were closed due to particulates falling from the air ducts. An internal email from the engineer & safety officer to administrators at the hospital described the problem as this: “The dust is depositing on HVAC registers, ceilings, walls, and on medical equipment. Maintenance continues to clean the surfaces but, as the staff has observed, the dust reappears within a short time. At least three staff members have indicated their concern that this environment has affected them. They have been sent to employee health and to their individual physicians.”

The information related to this issue determined as part of the incident investigation can be captured within a Cause Map, a visual form of root cause analysis. The first step of the process is to determine the impacts to the goals. In this case, both patient and employee safety are impacted due to the risk of illness from exposure to the particulates. The environmental goal is impacted because of the release of the particulates into the facility. Patient services are impacted because patients are being sent to other facilities as sterile procedures are not being performed (an impact to the production/ schedule goal). The labor and time required for an investigation is also an impact to the goal.

The second step of the process is the analysis: determining why these goals were impacted. The release of the particulates into the facility is because there are particulates within the air ducts, and the air ducts open into the facility to provide heating, ventilation and air conditioning. In order to determine where the particulates come from, first it must be determined what they are composed of. An environmental analysis determined that the particulates were rust, crumbling concrete, fiberglass fibers, and cladosporium (a common mold).

The analysis also identified that rust in air systems typically results from aged equipment exposed to moisture. Cladosporium also results from exposure to moisture. The air duct system pulls in outside air, including humidity, resulting in the system being exposed to moisture. The VA hospital is 45 years old, which actually makes it one of the “newer” VA facilities. (According to the VA, about 60% of its facilities are more than 60 years old.) While it’s unclear what maintenance or replacements have been performed on these components over the life of the facility, deferred maintenance is a general problem at VA facilities. According to the VA inspector general, there is a $10-12 billion maintenance backlog at the department.

Once the causes of the problems (or impacted goals) have been determined, the last step is to implement action items to reduce the risk of the problem recurring. There are two parts to this step: brainstorming possible solutions, and determining which will be most effective to meet the organization’s needs. The hospital considered bringing in mobile surgical units and installing high efficiency particulate air filters in the vents in the operating rooms. The cost of the mobile surgical units (over $70,000 per month) led the hospital to select only the solution of the air filters. At least one operating room is expected to be ready to return to service June 1st.

To view a one-page downloadable PDF of the incident investigation, including the impacted goals, analysis with evidence, and possible solutions, please click on “Download PDF” above.

Multiple Factors Contributing to Health Care Crisis in Venezuela

By ThinkReliability Staff

Venezuela is facing a health care crisis of massive proportions. Since 2012, the infant mortality rate has skyrocketed from 0.02% to more than 2%. (The latest numbers are from 2015, so this is a hundred-fold increase within 3 years.) The mortality rate for new mothers increased almost 5 times over the same period. Everyone else isn’t doing too well either. Says Dr. Yamila Battaglini, a surgeon at J. M. de los Ríos Children’s Hospital, “There are people dying for lack of medicine, children dying of malnutrition and others dying because there are no medical personnel.” That doesn’t even cover all of the problems facing Venezuela right now, which include:

Rolling blackouts: The government has announced official “rolling” blackouts of at least 40 days. That includes hospitals and other medical facilities. (Doctors are reporting having to work in the dark.) At least one hospital has a generator that doesn’t work. One reason electricity is being rationed is that even though money has been allocated to building new power plants, the plants aren’t online, and the money hasn’t been accounted for. (Unfortunately this kind of potential theft/ corruption is much too common in Venezuela). Another reason is . . .

Drought: The Guri hydroelectric dam provides 75% of the nation’s electricity, and currently has extremely low levels due to drought. The drought, caused by El Niño, has also resulted in a general lack of water, which is now being rationed. The combination means that the hospital doesn’t have adequate water supplies, resulting in . . .

Lack of sanitation: Without water, sanitation suffers. Doctors have reported performing surgery after a quick rinse from a water bottle, and no rinsing down of surgical beds or instruments before the next surgery, or procedure. But the people who are getting surgery or procedures are lucky, because many hospitals are also suffering from . . .

Shortages of medical personnel: Many medical professionals have left Venezuela during the severe ongoing economic issues (such as inflation, currently pegged at 700%) due to both the decreasing price of oil (Venezuela’s main export) and what have been called “disastrous” government policies. Says Ricardo Hausmann, Professor at the Kennedy School of Government (and Venezuela native), “Venezuela’s problems are a consequence of the craziest economic policy ever in a country or in the world. It’s a country that has gone through its longest and highest oil boom in its history, and ended that period over-indebted, with a destroyed productive capacity, and now it cannot face the reduction in the price of oil.” Doctors that remain face exhaustion – without water and power, many are attempting to save lives by manually operating equipment (such as respirators for newborns). Even this can’t save lives with . . .

Shortages of drugs and equipment: The Pharmaceutical Federal of Venezuela estimates that the country is lacking ~80% of needed basic medical supplies. Price controls in Venezuela resulted in official selling prices lower than manufacturing costs. This made it financially infeasible to provide many products. The government can’t afford to import drugs, and individuals have difficulty doing so because official currency exchange isn’t available. (Even if it was, Venezuelan money is virtually worthless at this point, as the government keeps printing more.) Theft and corruption have also resulted in the loss of some equipment. And as if this all weren’t enough, the country is also suffering from . . .

Zika outbreak: To a country that lacks almost all ability to provide health care, add an ongoing outbreak (see our previous blog) for which there is currently no cure, and you end up with a situation where “some come here healthy, and they leave dead.” (Dr. Leandro Pérez, Luis Razetti Hospital)

With this many (and this severe) problems, there are no easy answers. Making the situation even worse is the government’s denial that there IS a problem. Says President Nicolás Maduro, “I doubt that anywhere in the world, except in Cuba, there exists a better health system than this one.” This is preventing other countries from providing aid, sometimes because they are unaware the extent of the need. At least one country, India, is offering drugs for oil, though that may be mainly to recoup funds they are already owed, not for providing new medication.

In order to see the multitude of causes that have resulted in the health care crisis in Venezuela laid out in a visual cause-and-effect format, click on “Download PDF” above. Or click here to read more.

Regulators ask hard questions about blood testing startup Theranos

By Kim Smiley

The biotech startup Theranos has been all over headlines in recent years.  At first the company made news for its ambitious goals of running comprehensive laboratory testing on just a few drops of blood.  The company has claimed to have created a handheld medical device (nicknamed Edison) that uses only a finger prick of blood and makes blood testing less painful, faster and cheaper.  Theranos’ young and compelling founder Elizabeth Holmes has been featured in multiple magazines, gave a popular Ted talk and has even been compared to Steve Jobs and Bill Gates. In 2014, the company was valued at $9 billion.

Lately, the type of headlines the company has made have changed as the company has been embroiled in controversy.  The multiple concerns about Theranos can be visually represented in a Cause Map, a visual format for performing root cause analysis.  A Cause Map intuitively breaks down a problem to the basic cause-and-effect relationships and visually lays them out.  (Click on “Download PDF” to view an intermediate Cause Map of these issues.)  Many of the issues raised haven’t been proven yet and require more evidence so a question mark is used to note this open question within the cause box.

The problems for the company started coming to a head in the latter half of 2015. A December 2015 report by The Wall Street Journal, At Theranos, Many Strategies and Snags, raised concerns about the accuracy of the company’s propriety handheld blood testing device.  Studies showed that the results of the Edison device differed from testing done by traditional blood testing methods. Additionally,  inspections over a three-week period in August and September 2015 at two Theranos facilities found multiple issues.  Specifics on the exact problems found during the inspections have not been released, but they have been described generically as problems with record keeping, quality audits, and handling of consumer complaints. The FDA has also raised concerns about the approval of a medical device called a nanotainer that is used by Theranos. The nanotainer was classified as a Class I exempt device during the approval process and it should have been classified as a risky Class II device that would have received greater scrutiny during the approval process.

A federal criminal investigation into Theranos is now underway looking into claims the company made about its technology.  A separate probe by the Securities and Exchange Commission is working to determine whether the company misrepresented its new blood testing technology and its claim that it could run a full range of laboratory tests from just a prick of blood from a finger.

As of right now, Theranos has taken a beating in the court of public opinion, but the company has not been convicted of anything and is still selling blood tests from 40 Walgreens in Arizona.  Only time will tell the fate of the company, but the issues it has faced can be seen as a cautionary tale for other biotech startups.  Even if the company is cleared of all wrongdoing, there are lessons to be learned about ensuring laboratories meet all appropriate standards and ensuring proper approvals of all medical devices.