Tag Archives: best solutions

Put down the cookie dough

By ThinkReliability Staff

Almost everybody knows that there are potential risks with eating raw cookie dough (or any other raw batter).  However, much of that risk was thought to be due to the potential of salmonella from raw eggs and so, if the plan was to eat, rather than cook, the dough, the eggs could just be left out.  No more! say health experts.  Turns out that just removing the eggs and eating the raw dough may protect you from salmonella, but it still leaves you at risk for E. coli.

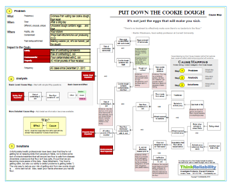
A Cause Map, or visual form of root cause analysis, can help demonstrate the risks (or potential impacts) associated with an issue, as well as the causes that lead to those risks.  The process begins by capturing the what, when and where of an incident, as well as the impact to the goals in an Outline.  In this case, the problems being addressed are risk of illness from eating raw cookie dough, as well as a recall associated with contaminated flour.  The when and where are just about everywhere that dough or batter is being made (or eaten).  The safety risks most commonly associated with eating raw cookie dough are salmonella and now E. coli.  The environmental goal is impacted because flour is contaminated with E. coli and the property goal is impacted because of 45 million pounds of flour that have been recalled by the current recall.

Once the impacted goals are captured, they become the first “effects” in the cause-and-effect relationships.  The Cause Map is created by capturing all the causes that led to an effect.  In this case, the risk of contracting salmonella from eating raw cookie dough results from eggs being exposed to salmonella, and the salmonella not being effectively destroyed (by the heat of baking).  The risk of contracting E. coli results from a similar issue.

Cookie dough contains raw flour.  The cooking process kills E. coli (as well as salmonella), meaning cookies and other baked goods are safe to eat, but dough is not.  Distributed raw (uncooked) flour was found to be contaminated with E. coli (leading to the impacted environmental goal and the recall).  The flour was likely contaminated with E. coli while it was still wheat in the field.  Birds and other animals do their business just about wherever they want, and it’s got some bacteria in it, meaning that excrement that falls on wheat fields can deliver contamination to pre-flour.  (Quick side note: we frequently get asked when to stop asking “why” questions.  When you get to an answer that is completely outside your control, like why birds poop in wheat fields, for example, this is a good place to end the cause-and-effect reasoning.)

While flour is processed, the process isn’t designed to completely kill pathogens (unlike pasteurization, for example) and according to Martin Wiedmann, food safety professor at Cornell University, “There’s no treatment to effectively make sure there’s no bacteria in the flour.”  Flour is not designed to be a ready-to-eat product.

Once the causes related to an issue have been developed, the next step is to brainstorm and select solutions.  Unfortunately, health professionals have been clear that they’re not getting far on keeping birds from pooping in fields, nor is there some sort of miracle treatment that will ensure raw flour is safe from disease.  (Scientists underscore that flour isn’t less safe, it’s just that we are becoming more aware of the risks.  Says Wiedmann, “Our food is getting safer, but also our ability to detect problems is getting better.”)  The only way to reduce your risk of getting sick from raw cookie dough is . . . not to eat it at all.  Also, wash your hands whenever you handle flour. (This is of course after you’ve thrown out the floor involved in the recall, which you can find by clicking here.)

To view the Cause Map of the problems associated with raw cookie dough, please click on “Download PDF” above.

CDC provides guidance for states to respond to Zika cases

By ThinkReliability Staff

The first Zika cases related to the current outbreak were found in Brazil in May 2015, along with a dramatic increase in microcephaly in babies born in that year. (See our previous blog about the possible link – now verified – between Zika and microcephaly.) Microcephaly is a serious birth defect that impacts many children whose mothers contract Zika while pregnant.

Active Zika transmission currently exists in nearly all of South and Central America, the Caribbean, and some Pacific Islands. 934 people in the US have been infected with Zika; 287 of those infected are pregnant women. Most of these people were infected outside the country and then traveled to the US. Zika is primarily spread by mosquitos, but can also be transmitted through blood transfusion, laboratory exposure and sexual contact.

While no cases of transmission by mosquito have yet been reported in the continental US, the Centers for Disease Control and Prevention (CDC) has released a blueprint for states to respond to locally transmitted cases of Zika. A visual diagram outlining the steps to be taken from the blueprint (a Process Map) can be helpful. (To view the Process Map for the CDC’s interim Zika response process, click on “Download PDF”.)

The CDC’s plan involves four stages. The first stage is implemented during mosquito season. This stage involves surveillance for suspected locally transmitted infections (i.e. persons with “symptoms compatible with Zika virus infection who do not have risk factors for acquisition through travel or sexual contact”, with pending test results). Upon a suspected infection, state officials and the CDC should be notified. State or local officials will open an epidemiological investigation (including ongoing surveillance) and begin implementing controls, involving both reducing mosquito populations and continuing public outreach, with CDC assistance as needed.

Stage 2 occurs upon confirmation of a locally transmitted infection. At this point, notification expands to include local blood centers as well as others required by International Health Regulations. The CDC will assist with an expanded investigation, surveillance, and communication, including deployment of an emergency response team (CERT) if desired. Once Stage 2 has been reached, stand down will only occur after 45 days (3 mosquito incubation periods) without additional infections or when environmental conditions no longer permit transmission.

If there is confirmed Zika in two or more persons whose movement during the exposure period overlaps within a one-mile diameter, Stage 3 (widespread local transmission) is entered. First, local officials will attempt to determine the transmission area, the “geographic area in which multiperson local transmission has occurred and may be ongoing”. Communication, surveillance, testing and controls are enhanced and expanded. Interventions for blood safety and vulnerable populations (including pregnant women) are implemented.

Once the infection has spread outside a county, it enters Stage 4 (widespread multijurisdictional transmission). All steps taken in previous stages are expanded and enhanced. The CDC will evaluate whether local capacity is adequate for response, and will assist as needed. Stage 4 actions will be continued until the criteria for stand down is met.

Based on previous experience with two mosquito-transmitted diseases, chikungunya & dengue fever, the CDC does not believe Stage 4 will be reached within the United States. However, as Dr. Tim F. Jones, an epidemiologist for the State of Tennessee, says, “Even though the percentages and the likelihoods are incredibly low, the outcome is awful.” Risk is a function of probability and consequence. Even with a low probability, the high consequence makes the risk from Zika considerable, and worth planning for.

To view the Process Map, click on “Download PDF” above. Or, click here to view the CDC’s interim guidance.

.

It’s Faster to Send a Rescue Mission to the International Space Station Than to the South Pole

By ThinkReliability Staff

Yes, you read that correctly. Says Ron Shemenski, a former physician for the station, “We were stuck in a place that’s harder to get to than the International Space Station. We know we’re on our own.” A sick astronaut on the International Space Station can jump in the return vehicle permanently parked at the station and make it back to earth in about 3.5 hours. In contrast, just to get a plane to the Amundsen-Scott South Pole research station takes 5 days – in good weather. Which is not at all the situation right now – at the South Pole it’s the very middle of winter.

This makes for an incredibly risky evacuation. It’s so risky that the scientists at the station expect to stay there from February to October, no matter what. The on-site physician biopsied and administered chemotherapy to herself in 1999. A scientist who suffered a stroke in 2011 had to wait until the next scheduled flight. However, winter medical evacuations have been performed twice before in the history of the station (since 1957), in April 2001 and September 2003. These two evacuations were performed by the same company that will perform this rescue. On June 14, the National Science Foundation (who runs the station) approved the medical evacuation of a scientist there. Two flights left Calgary, Canada that same day.

What makes the evacuation so risky that there is a debate over whether or not to rescue an ailing scientist? There are multiple factors that are considered in the decision. These issues can be developed within a cause-and-effect diagram, presented as a Cause Map. The first step in the process is to determine the impacts to the goals that result from a problem. In this case, we will look at the problem of a scientist at the South Pole becoming ill and requiring evacuation. There is an impact to the patient safety goal due to the delay of medical treatment. There’s also an impact to the safety of the aircrew on the flights used to rescue the scientist. There’s also an impact to property/ equipment and labor/ time due to the risky, complex evacuation process.

In the analysis (the second step of the process), the impacted goals become the effect in the first cause-and-effect relationships. The delay in medical treatment for the patient (the ailing scientist) results because required treatment is not available at the station, although a physician and physician’s assistant staff the clinic throughout the winter. There’s also a delay for the decision to send an evacuation plane. In this case, a day and a half of deliberation were required. As previously discussed, normally planes do not arrive at the station during the winter. It’s happened only twice previously in the last nearly 60 years. In order to ensure safety, the crew at the station undergoes a rigorous medical screening, to prevent illnesses requiring evacuation as much as possible.

Medical treatment is also delayed by the time required for the plane to arrive at the South Pole, and then for the plane to return the patient to a medical treatment center. (Which center is determined by the nature of the medical issue, which has not been disclosed, but the nearest centers are thousands of miles away.) The trip to the South Pole takes at least 5 days because of the complexity of the process. It also poses a risk to the air crews making the trip. (There are two planes sent in; one for evacuation and one to remain nearby in a search-and-rescue capability.)

The conditions in Antarctica are the cause of many of the difficulties. The sun set at the station in March, and will not rise again until September, so the plane must land without any daylight. It also has to land on packed snow/ ice, which requires skis, as there are no paved runways and the average winter temperature is -76°F (with wind chill it feels like -114°F). At those temperatures, most jet fuel freezes, so only certain planes can make the trip. (This is why they’re coming from Canada.) The planes can only hold 12-13 hours of fuel, and the last leg of the trip (across Antarctica) takes 10 hours (again, in good weather) so after a few hours into the flight, the plane has to either turn back, or they must land at the South Pole, regardless of conditions. Due to the desolation of the area, there’s nowhere else to land or refuel.

Currently one plane has made it to the South Pole, where it will wait for at least ten hours to allow the flight crew to rest and monitor the weather. The second plane remains at the Rothera Research Station, on Adelaide Island on the edge of Antarctica. Check for updates by clicking here. View the one-page downloadable Cause Map by clicking “Download PDF” above.


Patients and Insurers Pay Big for Discarded Cancer Drugs

By ThinkReliability Staff

A recent study has found that the size of vials used for cancer drugs directly results in waste, and a significant portion of the high – and steadily increasing – cost of cancer drugs.  With most cancer medications available in only one or two sizes, usually designed to provide an amount of medication for the largest patients, many times medication is left over in each vial.

The researchers estimate that about $2.8 billion is spent by Medicare and other insurers reimbursing for medication that is discarded.

This cost – paying for medication that is literally thrown out in most cases – can be considered an impact to the property goal.  As the cost increases for drugs, it’s not only Medicare and other insurers that are impacted, but patients, many of whom pay a fixed percentage of their drug costs.  This impacts the patient services goal.  The disposal of these drugs has a potential environmental impact, impacting the environmental goal.  The impacts to the goals as a result of an issue, as well as the what, when and where of that issue, are captured in a problem outline, which is the first step of the Cause Mapping process, which develops a visual diagram of the cause-and-effect relationships (a type of root cause analysis).

The second step of the process is to begin with an impacted goal and develop the cause-and-effect relationships.  This can be done by asking “why” questions and ensuring that all the causes necessary to result in an effect are included.  In some cases, more than one cause is required to produce an effect.  In these cases, the causes are both connected to the effect and joined with an “AND”.

In this case, beginning with the property goal, we can ask “Why do Medicare and other insurers have increased costs?”  This is due to the increased cost of cancer drugs, which results from significant amount of medications being thrown away.  We can add evidence to the causes to support their inclusion in the Cause Map or provide additional information.  For example, the study found that the earnings on disposed medication made up 30% of the overall sales for one cancer medication.

A significant amount of medication is being thrown away because there is medication left over in each vial used to deliver the medication, and the leftover medication in the vials is thrown away.  Both these causes are required to result in the medication waste.  Leftover medication is thrown away because it can only be used in rare circumstances (within six hours at a specialized pharmacy).  There is leftover medication in the vials because the vials hold too much medication for many patients.  (Most medication is administered based on patient weight.)  The vials hold too much medication because many medications are provided in only one or two vial sizes.  This is true of 18 of the top 20 cancer drugs.  Providing alternate vial size is not required by regulators, whose concern is limited to patient safety or potential medical errors.  Specifically, Congress has not authorized the US Food and Drug Administration (FDA) to consider cost. Drug manufacturers select vial size based on “marketing concerns” or, effectively, profit.  The study found that providing more vial sizes for one medication would reduce waste by 84% but would also reduce sales by $261 million a year.

Several of the vials for cancer medications are sized based on a larger (6’6″, 250 lb.) patient.  According to one drug manufacturer, this is done by design, resulting from working with the FDA for a vial that would provide enough medication “for a patient of almost any size.”  At least one drug manufacturer has suggested that the full vial be administered regardless of patient size, but one of the study’s co-authors says that extra medication does nothing to help patients, so it would still be wasted.

Instead, the researchers propose that the government either mandate the drugs be distributed in multiple vial sizes that would minimize waste, or that the government is refunded for wasted quantities.  They point out that alternate vial sizes are provided in Europe, “where regulators are clearly paying attention to this issue”, says Dr. Leonard Saltz, a co-author of the study.

To view the initial outline, Cause Map and proposed solutions, please click on “Download PDF” above.  Click here to view the study and drug waste calculator.

Shoveling snow really can trigger heart attacks

By Kim Smiley

You may have heard that shoveling snow can trigger a heart attack and studies have found that there is truth behind that concern.  Before you pick up a shovel this winter, there are a few things you should know.

Shoveling can be much more strenuous than many people realize – even more strenuous than running at full speed on a treadmill.  Snow shoveling also tends to be a goal-oriented task.  People want to clear the driveway before they stop and they may push their bodies beyond the point where they would if they were exercising for fitness.

Cold temperatures can increase the risk of heart problems occurring.  When a body gets cold, the arteries constrict and blood pressure can increase, which in turn increases the risk of heart issues.  High blood pressure and a sudden increase in physical activity can be a dangerous combination.  Additionally, it may take longer than normal for emergency help to arrive if it is needed because of snow and ice on the roadways which makes the situation potentially even more dangerous.

If you are young and fit, snow shoveling can be a great workout (and maybe you could help out your elderly neighbors if possible…), but if you are at risk of heart problems, you may want to put some thought into how you attack the problem of clearing your driveway and/or sidewalks.  First off, you should know if you are potentially at high risk.  Studies have found that people over 55 are four times more likely to experience heart-related issues while shoveling and men are twice as likely as women. People with known heart problems, diabetes or high blood pressure are also potentially high-risk.  Anybody who is sedentary is also at a higher risk of heart issues than somebody who exercises regularly.

So what should you do if you are concerned about the risk of heart problems and shoveling?  If possible, you may want to avoid shoveling if there is somebody else who can do it.  If you are determined to shovel yourself, make sure you drink lots of water and dress warmly.  Try to push the snow if possible, rather than shoveling it.  It is also generally better to shovel lots of lighter loads rather than fewer, heavy loads.  If possible, you may want to shovel several times throughout the storm to spread the work out over time. Take frequent breaks and stop immediately if you feel tired, lightheaded, short of breath or your chest hurts. Stay safe this winter!

To see a Cause Map, a visual root cause analysis, of this issue, click on “Download PDF” above.  A Cause Map visually lays out all the causes that contribute to an issue so that it can be better understood.  This example Cause Map also includes evidence and potential solutions.

New study finds that cholera vaccine helps protect community

By Kim Smiley

There are an estimated 3 to 5 million cases of cholera worldwide each year, believed to cause more than 100,000 deaths annually.  Cholera is rare in developed nations, but has been pandemic in Asia, Africa and Latin America for decades.  Researchers continue to search for an effective method to prevent cholera outbreaks.  A recent study found that a cheap oral vaccine is an effective tool to help prevent the spread of cholera.  The vaccine is not a perfect solution, but the study found that when two-thirds of the population was given the vaccine, cholera infections in an urban slum were reduced by nearly 40 percent.

The problem of cholera infections can be analyzed by building a Cause Map.  A Cause Map is a visual root cause analysis that intuitively lays out the cause-and-effect relationships of the multiple causes that contribute to an issue.  A Cause Map is built by asking “why” questions and documenting the answers in cause boxes.  To see how a Cause Map of this issue could be built, click on “Download PDF” above.

So why are so many people infected with cholera each year? Cholera is not generally passed from person to person and is predominantly spread through drinking water contaminated with cholera bacterium.  The feces of an infected individual carry cholera bacterium.  Cholera outbreaks occur in areas where there is a person infected with cholera in a location with poor sanitation infrastructure and inadequate water treatment.

Many efforts to reduce the number of cholera cases have focused on providing clean drinking water and providing sanitization equipment.  A recent study looked at three populations in Bangladesh: one was only given the vaccine, the second was given the vaccine, a hand-washing station and taught how to sterilize drinking water, and no intervention was done on the third population. The results showed that the vaccine alone was nearly as effective at preventing cholera as providing the vaccine along with a hand-washing station and instructions on sterilizing drinking water.  In the study, people were given two doses of the vaccine which costs about $3.70.

In an ideal world everyone would have access to clean, safe drinking water, but the resources required to build the needed infrastructure are not likely to be available any time in the near future.  Having a relatively cheap vaccine that is proven to slow the spread of cholera during an outbreak should prove to be a powerful tool in situations where access to clean water is limited.

How One Hospital Improved Heart Attack Care

By ThinkReliability Staff

The heart is responsible for pumping blood through the body, but it also requires blood flow to continue functioning. When the blood supply to the heart is cut off, it’s known as a heart attack and it can be deadly. According to the Centers for Disease Control and Prevention (CDC), about 15% of people who have a heart attack will die from it. Time is of the essence when treating heart attacks. Again according to the CDC, “The more time that passes without treatment to restore blood flow, the greater the damage to the heart.”

Treatment to restore blood flow is generally a balloon (which pushes aside the blockage) and a stent (which holds the artery open). In the United States, this is performed in a hospital. Although hospitals can’t control the amount of time it takes to get a heart attack victim TO the hospital, they can control the time from when a patient enters the hospital until treatment is begun. This is known as the door to balloon (or D2B) time.

A national campaign to improve the speed of heart attack treatment was launched. At that time, the typical heart attack process went like this: a patient suffered a heart attack and (hopefully) 911 was called. An ambulance picked up the patient and delivered them to a hospital. Once the patient arrived at the hospital, an electrocardiogram (EKG) was taken and transmitted to a cardiologist, who determined whether or not the patient was suffering from a heart attack. If it was a heart attack, an interventional cardiologist and other members of the heart attack team were called and made their way to the hospital. The patient was taken through a consent and surgical prep process, and then then balloon and stent were installed. At this time, the national goal was for half of patients to receive a stent and balloon within 90 minutes of arrival at a hospital.

One of the hospitals to take up the challenge was Our Lady of Lourdes Medical Center in New Jersey. In 2007, heart attack treatment was on par or better than other hospitals, with half of patients treated within 93 minutes. (In many locations it took more than 2 hours.) By 2011, treatment time was down to 71 minutes. The head of the cardiovascular disease program challenged the staff to continue to decrease the time and staff members set up a “D2B task force”. This task force looked at each step in the process for potential improvements. Some individual steps were shortened. The forms required for consent were reduced as much as possible. The time spent individually calling in all the members of the cardiac care team was reduced by having a single call ring to all their pagers. Those on the team that were on call were limited to being 30 minutes away from the hospital.

Other steps, instead of being performed one after the other, were performed simultaneously. Instead of waiting for the patient to arrive at the hospital for an EKG, it is taken in the ambulance and transmitted to the emergency room. Each step required for surgical prep is performed as much as possible simultaneously by a team. Additionally, one surgical room is reserved for heart attack patients and is kept stocked with necessary supplies.

Now the median D2B time is 50 minutes. This was demonstrated on March 29, when a patient arrived at the medical center at 1:54 AM and whose D2B time was 55 minutes. This was unusually long for the center. What caused the difference? Because the patient was a 49-year-old woman with ambiguous symptoms, the emergency room doctor waited until the patient arrived at the hospital for another EKG to verify the heart attack before the heart attack team was called.

From 2003 to 2013 the death rate from coronary heart disease has fallen 38%. Some of this drop is attributed to better control of cholesterol and blood pressure, but some is surely due to quicker treatment at most US hospitals.

The “before” and “after” process map that shows the flow of heart attack treatment at Our Lady of Lourdes Medical Center can be diagrammed visually to show how the process flows. To view the process map, the problem outline and timeline of the treatment of the heart attack patient on March 29, 2015, please click on “Download PDF” above. Or click here to read more.

Cuba Eliminates Transmission of HIV from Mother to Child

By ThinkReliability Staff

On June 30, 2015, the World Health Organization (WHO) declared mother-to-child transmission (MTCT) of HIV in Cuba eliminated. Clearly, this is fantastic news. Says Dr. Margaret Chen, WHO Director-General, “Eliminating transmission of a virus is one of the greatest public health achievements possible. This is a major victory in our long fight against HIV and sexually transmitted infections, and an important step towards having an AIDS-free generation.” The fight against HIV continues, with a global target of less than 40,000 new child infections per year by 2015.   (In 2013, there were 240,000 children born with HIV worldwide.) It’s hoped that the progress made in Cuba can be extended to the rest of the world.

How did Cuba do it? Root cause analysis can be used to determine causes of positive impacts as well as negatives. Here we will use a Cause Map, or visual root cause analysis, to determine the causes that resulted in Cuba being declared free of MTCT of HIV. Instead of defining the “problem” in a problem outline, we will define the success using the same format. In this case, the elimination of transmission of HIV from mother to child is the success we’ll be looking at. This success impacts goals as well, though positively. The child safety goal is impacted because it is now very rare (only 2 in 2013) for children to receive HIV from their mothers. The maternal safety goal is impacted because mothers are receiving effective treatment for HIV. Other goals are impacted because of the decreased need for services for children who might otherwise have been infected with HIV.

Beginning with an impacted goal, we can ask Why questions. Why is it rare for children to receive HIV from their mothers? Because the risk of passing HIV from mother to child has been lessened. Why? Because when children are born to HIV-infected mothers, there is decreased exposure to infants from their mother’s bodily fluids, and both mothers and children are being treated effectively for HIV. Decreased exposure to bodily fluids has been accomplished by the use of Cesarean sections and substitution for breastfeeding. Effective HIV treatment results from awareness of the presence of HIV infection from testing performed by healthcare providers, seen as part of a five-year initiative that gave universal healthcare coverage and access. That same access allowed treatment for infected moms and their children with antiretrovirals.

Although this Cause Map is presented as a positive impact to the goals, it could also be presented as an analysis of the problem of HIV transmission from mother to child. The causes would be baby’s exposure to mom’s body fluids, and lack of effective treatment due to lack of knowledge of infection and/or lack of access. The solutions to that Cause Map are the causes presented here in the positive Cause Map. (For example, use of Cesarean sections and substitutions for breastfeeding are solutions to the cause of baby being exposed to mom’s body fluids.)

In order to receive validation from WHO of the elimination of MTCT of HIV, Cuba had to meet very specific indicators for a defined period of time. These indicators do not just measure the overall success of the program (impact indicators), but also measure the success of the initiatives meant to achieve those goals (process indicators). Impact indicators included reducing MTCT of HIV to less than 50 cases per 100,000 live births, less than 5% in breastfeeding populations, and less than 2% in non-breastfeeding populations for at least 1 year. Process indicators included more than 95% of all pregnant women receiving at least one antenatal visit, more than 95% of pregnant women knowing their HIV status, and more than 95% of HIV-positive pregnant women receiving antiretroviral drugs for at least 2 years.

With implementation of similar initiatives across the world, it is hoped that MTCT of HIV will continue to decrease rapidly.

To view the outline, Cause Map, and indicators, click on “Download PDF” above. Click here to read the release from the WHO.

Identifying and Preventing Causes of Lab Errors

By ThinkReliability Staff

A man was mistakenly told he had HIV. A baby who died from a blood disorder that could have been treated during pregnancy, but wasn’t because the routine blood screen came back clear. A little girl who had to receive a second transplant after the test to verify her acceptance of a new organ was run incorrectly. These are just some of the cases mentioned in a watchdog report about how laboratory errors and weak oversight put patients at risk.

There are 7 to 10 billion medical laboratory tests run in the US every year. Lab tests influence about 70% of medical decisions. Having the wrong information from these tests can be deadly, and there is no good data about how many lab tests may be inaccurate, or may be negitively impacting patient safety. Laboratories are generally overseen by accrediting organizations but the results are almost always private, and there have been recent cases where federal regulators have had to step in because serious deficiencies in lab processes were identified.

The risk isn’t just for patients. An employee was infected with HIV and hepatitis C after a machine malfunctioned, splashing contaminated blood product onto her face. The employee had warned her boss previously that the machine was broken and cross-contaminating samples. Patients can also receive wrong information that isn’t harmful to their physical health but causes all sorts of other problems, such as incorrectly run paternity tests that improperly rule out a man as the father of a child.

The process involved in laboratory testing – from taking a specimen from a patient to delivering the results – is complex, and there are potential issues at each step that can lead to inaccurate results. These causes can be visually diagrammed in a Cause Map, or a visual cause-and-effect diagram. (To view the Cause Map, click “Download PDF” above.) In this case, potential causes of lab errors are captured and analyzed for potential solutions. These causes include labeling of samples, time and storage conditions of the samples, use of proper (and non-expired) products to treat the samples, and calibration of the machines used for the testing.

Actions that reduce the risk of inaccurate lab results should be in place at all labs, but even with a well-planned process, mistakes can happen. That makes the addition of checks and oversight into the process incredibly important. Says Michael Baird, the chief science officer and laboratory director at DNA Diagnostics Center, “I will agree that mistakes are something that can happen whatever you do. You just need to have the appropriate controls in place for when a mistake happens, (so) you can catch it before it goes out the door.”

For example, at the lab Baird runs, samples used for DNA checks are run independently by two different technicians and when a man is ruled out as the father of a child, there is a double-check in place. Other labs have incorporated alert systems for time-sensitive specimens and have hired technical directors responsible for overseeing the labs.

There are also steps patients themselves can take to minimize the impact on their safety from potential lab testing errors. First, ensure that any samples taken are labeled immediately and with accurate information. If you’re at all unsure about a test result, get a second opinion at a different lab. Complaints about a lab should be directed to state health officials.

To view the Cause Map addressing potential causes of laboratory errors, click “Download PDF”. To learn more, read the watchdog report.

What Caused an HIV Outbreak in Rural Indiana?

By Kim Smiley

A public health emergency has been declared after 79 cases of HIV were confirmed in rural Indiana, the worst outbreak of HIV the state has ever seen.  Individuals potentially at risk have been encouraged to get tested and the number of cases is expected to rise as more cases are identified. The epidemic has been tied to intravenous drug use, although other risky behaviors may also have spread the disease.

In order to effectively fight this HIV epidemic and hopefully reduce the risk of outbreaks in the future, the factors that have led to these HIV cases needs to be understood. This region has been struggling with the use of Opana, a powerful opioid painkiller, for years.  Opana is commonly injected and health officials believe that the use of dirty needles has been the primary driver of HIV infections although unprotected sex was also a potential pathway for infection for some.  Needle exchange programs are illegal in Indiana and access to clean needles is limited so needles are being shared.  In an environment where needle sharing is common, it takes only one individual infected with HIV to rapidly spread the virus to many other drug users.

HIV is also more likely to be spread if infected individuals are unaware that they are infected and are not being treated.   Identifying an individual who has contracted HIV as early as possible and providing treatment helps prevent the disease from spreading because an HIV-positive person who receives sustained treatment is drastically less infectious, even if they continue to engage in high risk behaviors. Access to healthcare and HIV testing is limited in this region where many residents are uninsured and may lack transportation. Heroin use has long been tied to HIV, but users of Opana (a licensed pharmaceutical) may not have been fully aware of the potential risk from sharing needles.

Now that the HIV epidemic has been identified, healthcare officials are working to reduce the risk of more infections by providing testing and treatment.  One physician is even driving door to door, offering free HIV testing and trying to educate residents on drug addiction and HIV treatment.  Austin, Indiana has established its first ever HIV clinic to provide testing, counseling and treatment.  Targeted resources to help educate residents on drug use and to assist addicts seeking to get clean are also being provided.  The governor of Indiana has approved a short term needle exchange program.  Indiana has also created a public awareness campaign to help inform people about the risks of intravenous drug use.  Drug addiction is a notoriously difficult problem to battle, but the additional resources should help reduce the rate of future HIV cases.

To view a high level Cause Map, a visual root cause analysis, of this issue, click on “Download PDF” above.