Tag Archives: Root Cause Analysis

Patient receives double dose of radiotherapy

By ThinkReliability Staff

The risk associated with medical treatment administration is high. There is a high probability for errors because of the complexity of the process involved in not only choosing a treatment, but ensuring that the amount and rate of treatment is appropriately calculated for the patient. The consequence associated with treatment errors is significant – death can and does result from inappropriately administered treatment.

Medical treatment includes delivery of both medication and radiation. Because of the high risk associated with administering both medication and radiation therapy, independent checks are frequently used to reduce risk.

Independent checks work in the following way: one trained healthcare worker performs the calculation associated with medical treatment delivery. If the treatment is then delivered to the patient, the probability that a patient will receive incorrect treatment is the error rate of that healthcare worker. (For example, a typical error rate for highly trained personnel is 1/1,000. If only one worker is involved with the process, there is a 0.1% chance the patient will receive incorrect treatment.) With an independent check, a second trained worker performs the same calculations, and the results are compared. If the results match, the medication is administered. If they don’t, a secondary process is implemented. The probability of a patient receiving incorrect treatment is then the product of both error rates. (If the second worker also has an error rate of 1/1,000, the probability that both workers will make an error on the same independently performed calculation is 1/1,000 x 1/1,000, or 0.0001%.)

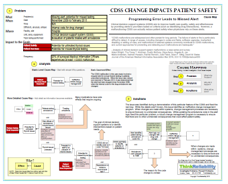
However, in a case last year in Scotland, a patient received a significant radiotherapy overdose despite the use of independent checks, and verification by computer.   In order to better understand how the error occurred, we can visually diagram the cause-and-effect relationships in a Cause Map. The error in this case is an impact to the patient safety goal, as a radiotherapy overdose carries a significant possibility of serious harm. The Cause Map is built by starting at an impacted goal and asking “why” questions. All causes that result in an effect should be included on the Cause Map.

In this case, the radiotherapy overdose occurred because the patient was receiving palliative radiotherapy, the incorrect dose was entered into the treatment plan, and the incorrect dose was not caught by verification methods. Each of these causes is also an effect, and continuing to ask “Why” questions will develop more cause-and-effect relationships. The incorrect dose was entered into the treatment plan because it was calculated incorrectly (but the same) by two different radiographers working independently. Both radiographers made the same error in their manual calculations. This particular radiotherapy program involved two beams (whereas one beam is more common). The dose for each beam then must be divided by two (to ensure the overall dose is as ordered). This division was not performed, leading to a doubled calculated dose. The inquiry into the overdose found that both radiographers used an old procedure which was confusing and not recommended by the manufacturer of the software that controlled the radiotherapy delivery. While a new procedure had been implemented in February 2015, the radiographers had not been trained in the new procedure.

Once the two manual calculations are performed, the treatment plan (including the dose) was entered into the computer (by a third radiographer). If the treatment plan does not match the computer’s calculations, the computer sends an alert and registers an error. The treatment plan cannot be delivered to the patient until this error is cleared. The facility’s process at this point involves bringing in a treatment planner to attempt to match the computer and calculated doses. In this case, the treatment planner was one of the radiographers who had first (incorrectly) performed the dose calculation. The radiographers involved testified that alerts came up frequently, and that any click would remove them from the screen (so sometimes they were missed altogether).

The inquiry found that somehow the computer settings were changed to make the computer agree with the (incorrect) manual calculations, essentially performing an error override. The inquiry found that the radiographers involved in the case believed that the manually calculated dose was correct, likely because they didn’t understand how the computer calculated doses (not having had any training on its use) and held a general belief that the computer didn’t work well for calculating two beams.

As a result of this incident, the inquiry made several recommendations for the treatment plan process to avoid this type of error from recurring. Specifically, the inquiry recommended that the procedure and training for manual calculation be improved, independent verification be performed using a different method, procedures for use of the computer be improved (including required training on its use), and requiring manual calculations to be redone when not in agreement with the computer. All of these solutions will reduce the risk of the error occurring.

There is also a recommended solution that doesn’t reduce the risk of having an error, but increases the probability of it being caught quickly. This is to outfit patients receiving radiotherapy with a dosimeter so their received dose can be compared with the ordered dose. (In this case, the patient received 5 treatments; had a dosimeter been used and checked the error would likely have been noticed after only one.)

To view the Cause Map for this incident, please click on “Download PDF” above.

It’s Faster to Send a Rescue Mission to the International Space Station Than to the South Pole

By ThinkReliability Staff

Yes, you read that correctly. Says Ron Shemenski, a former physician for the station, “We were stuck in a place that’s harder to get to than the International Space Station. We know we’re on our own.” A sick astronaut on the International Space Station can jump in the return vehicle permanently parked at the station and make it back to earth in about 3.5 hours. In contrast, just to get a plane to the Amundsen-Scott South Pole research station takes 5 days – in good weather. Which is not at all the situation right now – at the South Pole it’s the very middle of winter.

This makes for an incredibly risky evacuation. It’s so risky that the scientists at the station expect to stay there from February to October, no matter what. The on-site physician biopsied and administered chemotherapy to herself in 1999. A scientist who suffered a stroke in 2011 had to wait until the next scheduled flight. However, winter medical evacuations have been performed twice before in the history of the station (since 1957), in April 2001 and September 2003. These two evacuations were performed by the same company that will perform this rescue. On June 14, the National Science Foundation (who runs the station) approved the medical evacuation of a scientist there. Two flights left Calgary, Canada that same day.

What makes the evacuation so risky that there is a debate over whether or not to rescue an ailing scientist? There are multiple factors that are considered in the decision. These issues can be developed within a cause-and-effect diagram, presented as a Cause Map. The first step in the process is to determine the impacts to the goals that result from a problem. In this case, we will look at the problem of a scientist at the South Pole becoming ill and requiring evacuation. There is an impact to the patient safety goal due to the delay of medical treatment. There’s also an impact to the safety of the aircrew on the flights used to rescue the scientist. There’s also an impact to property/ equipment and labor/ time due to the risky, complex evacuation process.

In the analysis (the second step of the process), the impacted goals become the effect in the first cause-and-effect relationships. The delay in medical treatment for the patient (the ailing scientist) results because required treatment is not available at the station, although a physician and physician’s assistant staff the clinic throughout the winter. There’s also a delay for the decision to send an evacuation plane. In this case, a day and a half of deliberation were required. As previously discussed, normally planes do not arrive at the station during the winter. It’s happened only twice previously in the last nearly 60 years. In order to ensure safety, the crew at the station undergoes a rigorous medical screening, to prevent illnesses requiring evacuation as much as possible.

Medical treatment is also delayed by the time required for the plane to arrive at the South Pole, and then for the plane to return the patient to a medical treatment center. (Which center is determined by the nature of the medical issue, which has not been disclosed, but the nearest centers are thousands of miles away.) The trip to the South Pole takes at least 5 days because of the complexity of the process. It also poses a risk to the air crews making the trip. (There are two planes sent in; one for evacuation and one to remain nearby in a search-and-rescue capability.)

The conditions in Antarctica are the cause of many of the difficulties. The sun set at the station in March, and will not rise again until September, so the plane must land without any daylight. It also has to land on packed snow/ ice, which requires skis, as there are no paved runways and the average winter temperature is -76°F (with wind chill it feels like -114°F). At those temperatures, most jet fuel freezes, so only certain planes can make the trip. (This is why they’re coming from Canada.) The planes can only hold 12-13 hours of fuel, and the last leg of the trip (across Antarctica) takes 10 hours (again, in good weather) so after a few hours into the flight, the plane has to either turn back, or they must land at the South Pole, regardless of conditions. Due to the desolation of the area, there’s nowhere else to land or refuel.

Currently one plane has made it to the South Pole, where it will wait for at least ten hours to allow the flight crew to rest and monitor the weather. The second plane remains at the Rothera Research Station, on Adelaide Island on the edge of Antarctica. Check for updates by clicking here. View the one-page downloadable Cause Map by clicking “Download PDF” above.


Millions of sippy cups recalled

By Kim Smiley

On May 27, 2016, it was announced that 3.1 million Tommee Tippee Sippee spill-proof cups were being recalled because of concerns about mold. The issue came to light after consumers called the company to complain about finding mold in children’s cups and several alarming photos of moldy cup valves were posted on the company’s Facebook page, some shared thousands of times. There have been more than three thousand consumer reports about mold forming in the cup valves, including 68 cases of illness that are consistent with consuming mold.

A Cause Map, a visual root cause analysis, can be built to better understand this issue. The first step in the Cause Mapping process is to fill in an Outline with the basic background information, including how the issue impacts the overall goals. In this case, the safety goal is impacted because 68 cases of illness have been reported. The regulatory call is impacted by the recall of the cups and the economic goal is impacted because of the high cost associated with recalling and replacing millions of cups. The time required to investigate and address the issue can be considered an impact to the labor/time goal. Additionally, the customer service goal is impacted because more than 3,000 consumers have reported mold in their sippy cups and because of the negative social media.

The next step in the Cause Mapping process is to build the Cause Map itself. The Cause Map is built by asking “why” questions and visually laying out the answers to show the cause-and-effect relationships. Understanding the many causes that contribute to an issue can help a broader range of solutions to be considered rather than focusing on a single “root cause” and focusing on solving only one issue. In this example, the mold is growing in the one-piece valve used in this model of cup. The valves remained moist, likely because they are not allowed to dry between uses, and they were not cleaned frequently enough to prevent mold growth. Many consumers have complained that it is very difficult or even impossible to adequately clean the cup valve which has contributed to the mold issue. In addition to the growth of the mold, one of the reasons children have gotten is sick is because it is hard to see the mold. Caregivers are unaware of the fact that the cups are moldy and continue to use them. (To see how these issue might be captured on a Cause Map, click on “Download PDF” above.)

The final step in the Cause Mapping process is to develop and implement solutions that will reduce the risk of the problem from reoccurring. In this case, all cup designs that use the single one-piece valve are being recalled and the valve replaced with either a trainer straw cup with no valve or a sippy cup with a new design two-piece valve that is easier to clean. The new two-piece valve comes apart in such a way that should also make it much easier to identify a potential mold issue, which should hopefully reduce the likelihood that a child will ingest mold. (If you think you may own one of these cups, you can get more information about how to get a replacement here.)

One of the interesting pieces of this case study is that the company has to work to address the technical issue with the valve design, but it also has to work to rebuild consumer trust. Consumers, especially when buying products for small children, will avoid a company if they don’t believe they take safety concerns seriously. This company has taken a beating online by outraged parents in the months leading up to the recall. In addition to designing a valve that will be less likely to harbor mold, it benefited the company to ensure the new design made it easy for parents to see that the cup valve was mold-free and safe. The company has also worked to spread information about the recall and tried to make it easy for consumers to get their recalled cups replaced. How a recall is handled has a huge impact on how consumers respond to the issue. A recall that isn’t handled well on top of an issue that has already shaken consumer trust can quickly spell disaster for a company. Consumers can be much more forgiving of an issue if a company responds quickly and if any necessary recalls are done as quickly and effectively as possible. It will be interesting to see how this company weathers this storm now that the cups have been recalled and the mold issue addressed.

NIH suspends work at two facilities

By Kim Smiley

Research has been suspended at two National Institutes of Health (NIH) facilities – a National Cancer Institute laboratory working on cell therapy production and a National Institute of Mental Health facility that makes positron emission tomography materials – over concerns about patient safety. A panel of experts determined that these facilities were not in compliance with quality and safety standards and they are shut down pending a review and any necessary upgrades.

A Cause Map, a visual format for root cause analysis, can be built to help understand this issue.  The first step in the Cause Mapping process is to fill in an Outline with the basic background information for an issue, along with how the issues impacts the overall goals. Thankfully, no patient harm has been identified as a result of issues at the facilities, but the potential for patient harm existed and potential impacts should be included on the Outline. No new patients will be enrolled in the affected trials until the issues are resolved and this is an impact to the schedule/operations goal. Once the Outline is complete, the Cause Map is then built by asking “why” questions and the answers are laid out to visually show the cause-and-effect relationships. (Click on “Download PDF” to see a completed Outline and high level Cause Map of this issue.)

So why was work at two NIH facilities shut down? A little background is needed to understand this issue. In April 2015, fungal contamination was found in products that were supposed to be sterile that were prepared at a different NIH facility, the Clinical Center’s Pharmaceutical Development Service. The investigation into the contaminated product found multiple deficiencies, both in the facility itself and in work practices. The deficiencies included a filter missing in an air handling system and insects found in two light bays in clean rooms. (Read our previous blog to learn more.) Following this issue, the director of NIH appointed a panel of experts to review safety compliance at all other NIH facilities that produce sterile or infused products for administration to research participants.

The panel’s evaluation is still underway, but preliminary findings determined that the two facilities in question are not in compliance with quality and safety standards and production has been suspended as a result.  The panel found that NIH has many outdated or inadequate facilities and that personnel lack expertise on applicable regulations, but no specific details about the deficiencies found have been released. NIH plans to do a rigorous review to identify and correct issues found before these facilities resume manufacturing sterile products. No timeline has been given at this point.

The final step in the Cause Mapping process is to identify and implement solutions to reduce the risk of similar errors reoccurring in the future. In addition to correcting the deficiencies found at these facilities, NIH is working on creating more oversight to help ensure manufacturing facilities are in compliance with safety regulations. The panel recommended the creation of both an outside hospital board to oversee the clinical center and a new central office to coordinate research quality and safety oversight.

Only time will tell how effective these solutions prove to be, but I find it promising that NIH proactively reviewed all of the facilities that produce sterile or infused products for administration to research participants following the fungal contamination issues last year.  It may be painful and embarrassing to suspend work at facilities, but the process is at least moving in the right direction if problems can be corrected before patients are harmed.

Programming Errors Can Impact Patient Safety

By ThinkReliability Staff

Clinical decision support systems (CDSS) aim to improve health care quality, safety and effectiveness by providing alerts to providers based on criteria (such as identifying drug interactions). However, a malfunctioning CDSS can actually reduce patient safety when physicians rely on these alerts.

According to “Analysis of clinical decision support system malfunctions: a case series and survey” by Adam Wright, et al, published March 28, 2016, “CDSS malfunctions are widespread and often persist for long periods. The failure of alerts to fire is particularly difficult to detect. A range of causes, including changes in codes and fields, software upgrades, inadvertent disabling or editing of rules, and malfunctions of external systems commonly contribute to CDSS malfunctions, and current approaches for preventing and detecting such malfunctions are inadequate.”

A survey that was part of the analysis found that 93% of Chief Medical Information Officers who responded had experienced at least one CDSS malfunction and two-thirds experienced at least an annual CDSS malfunction. Four such malfunctions were found within the CDSS system at Brigham and Women’s Hospital and were presented as case studies. We will examine one of these case studies within a Cause Map, or visual form of root cause analysis.

The first step in any root cause analysis method is to identify the problem. The CDSS malfunction in this case study involved a stopped alert for annual thyroid testing in patients prescribed amiodarone. When the issue was noticed and resolved in February 2013, it was determined that the alert had been stopped since November 2009, when the internal code for the drug amiodarone was changed.

An important step in describing the problem is to determine the organizational goals that were impacted. In this case, patient safety is impacted because of the potential for untreated thyroid issues and patient services are impacted because of the potential of missed testing.

The second step is to perform the analysis by developing the cause-and-effect relationships that led to the impacted goals. In this case, patient safety is impacted because of the potential for untreated thyroid issues. Patients may have untreated thyroid issues if they are taking amiodarone to treat arrhythmia. Amiodarone has a known side effect of thyroid issues. If staff is unaware of a patient’s thyroid issues, that patient won’t be treated. Staff would be unaware of thyroid issues in a patient if testing is not performed.

The goal of clinical decision support systems is to identify interventions based on patient needs – in this case, the hospital created an alert to suggest thyroid testing for patients who had been amiodarone and had not had a thyroid test in at least a year. Based on typical alert values from the years prior to 2009, the analysis determined that more than 9,000 alerts suggesting thyroid testing were missed.

Thyroid tests were missed because the CDSS did not identify the need for thyroid testing, and because physicians may rely on the CDSS to recommend a test like this one. The alert was originally set up to identify patients taking amiodarone (then code 40) with a start date at least 365 days ago, and no thyroid test values from within the last 365 days. In November 2009, the internal code for amiodarone changed to 7099, but the logic for the alert was not changed. (The reason for the code change is unclear.) As patient records were updated with the new code for amiodarone, the alert failed to identify them for thyroid testing.

The issue was identified during a demonstration of this particular feature of the CDSS and fixed the next day. While the details aren’t known, this issue identifies an ineffective change management program. When changes are made within systems, change management processes are necessary to ensure there are no unintended consequences. While updating the amiodarone code in the alert logic fixed this particular problem, a robust change management program is necessary to ensure that there are no other unintended consequences that could affect patient safety.

To view a visual root cause analysis of this example, please click on “Download PDF” above.

Family of Sepsis Victim Fights for Better Care

By ThinkReliability Staff

New York state has become a leader in identifying and treating sepsis. But it wasn’t always this way. On April 1, 2012, a twelve-year-old boy named Rory Staunton died from sepsis in a New York hospital (the subject of a previous blog). There were multiple opportunities that could have more quickly identified his sepsis, and potentially saved his life. After his death, Rory’s family founded the Rory Staunton Foundation For Sepsis Prevention. Part of the foundation’s mission is to improve diagnosis and treatment protocols for sepsis.

The foundation landed a success when New York state adopted what are known as “Rory’s Regulations” on December 31, 2013. These regulations require “health care providers to develop and implement protocols to rapidly diagnose and treat sepsis infections”. In addition, the state adopted hospital pediatric care regulations which specifically addressed many of the causes identified in Rory’s case. These include requirements to:

– Review of test results by a clinician familiar with the patient’s case: Blood tests ordered to be run immediately were not reviewed by the doctor who ordered them. Although initial tests showed abnormalities within an hour of Rory’s arrival, these results were not provided to the emergency department at all.

– Provide test results to the primary care provider: The test results were not provided to Rory’s primary care provider.

– Improve communications of test results to patients and parents: The test results were not provided to Rory’s parents

– Keeping patients in the hospital while awaiting critical test results: Rory had already left the hospital when the test results arrived. Because the results of the test were a matter of life or death, had his discharge been delayed while awaiting the results, the outcome may have been different.

Even with ensuring that test results make it into the right hands, diagnosing and treating sepsis is difficult. Rory’s Regulations also require developing protocols that will assist in sepsis detection and treatment. An international task force released updated definitions of sepsis and septic shock, as well as clinical guidance, in February 2016. The Centers for Medicare and Medicaid launched a new core measure for fiscal year 2016.

Another mission of the foundation is to increase public awareness and understanding of sepsis. The foundation requested the Centers for Disease Control and Prevention help them in this mission. The CDC launched its new sepsis website on May 29, 2014.

While New York’s regulations seem to have been a success (the state’s Department of Health estimates they will save at least 5,000 lives each year), the foundation isn’t stopping there. Their stated goal is to have similar regulations in place across the US by 2020.

To view the cause-and-effect relationships and the associated solutions laid out visually in a Cause Map, please click on “Download PDF” above. Click here to learn more about the Rory Staunton Foundation For Sepsis Prevention.

Patients and Insurers Pay Big for Discarded Cancer Drugs

By ThinkReliability Staff

A recent study has found that the size of vials used for cancer drugs directly results in waste, and a significant portion of the high – and steadily increasing – cost of cancer drugs.  With most cancer medications available in only one or two sizes, usually designed to provide an amount of medication for the largest patients, many times medication is left over in each vial.

The researchers estimate that about $2.8 billion is spent by Medicare and other insurers reimbursing for medication that is discarded.

This cost – paying for medication that is literally thrown out in most cases – can be considered an impact to the property goal.  As the cost increases for drugs, it’s not only Medicare and other insurers that are impacted, but patients, many of whom pay a fixed percentage of their drug costs.  This impacts the patient services goal.  The disposal of these drugs has a potential environmental impact, impacting the environmental goal.  The impacts to the goals as a result of an issue, as well as the what, when and where of that issue, are captured in a problem outline, which is the first step of the Cause Mapping process, which develops a visual diagram of the cause-and-effect relationships (a type of root cause analysis).

The second step of the process is to begin with an impacted goal and develop the cause-and-effect relationships.  This can be done by asking “why” questions and ensuring that all the causes necessary to result in an effect are included.  In some cases, more than one cause is required to produce an effect.  In these cases, the causes are both connected to the effect and joined with an “AND”.

In this case, beginning with the property goal, we can ask “Why do Medicare and other insurers have increased costs?”  This is due to the increased cost of cancer drugs, which results from significant amount of medications being thrown away.  We can add evidence to the causes to support their inclusion in the Cause Map or provide additional information.  For example, the study found that the earnings on disposed medication made up 30% of the overall sales for one cancer medication.

A significant amount of medication is being thrown away because there is medication left over in each vial used to deliver the medication, and the leftover medication in the vials is thrown away.  Both these causes are required to result in the medication waste.  Leftover medication is thrown away because it can only be used in rare circumstances (within six hours at a specialized pharmacy).  There is leftover medication in the vials because the vials hold too much medication for many patients.  (Most medication is administered based on patient weight.)  The vials hold too much medication because many medications are provided in only one or two vial sizes.  This is true of 18 of the top 20 cancer drugs.  Providing alternate vial size is not required by regulators, whose concern is limited to patient safety or potential medical errors.  Specifically, Congress has not authorized the US Food and Drug Administration (FDA) to consider cost. Drug manufacturers select vial size based on “marketing concerns” or, effectively, profit.  The study found that providing more vial sizes for one medication would reduce waste by 84% but would also reduce sales by $261 million a year.

Several of the vials for cancer medications are sized based on a larger (6’6″, 250 lb.) patient.  According to one drug manufacturer, this is done by design, resulting from working with the FDA for a vial that would provide enough medication “for a patient of almost any size.”  At least one drug manufacturer has suggested that the full vial be administered regardless of patient size, but one of the study’s co-authors says that extra medication does nothing to help patients, so it would still be wasted.

Instead, the researchers propose that the government either mandate the drugs be distributed in multiple vial sizes that would minimize waste, or that the government is refunded for wasted quantities.  They point out that alternate vial sizes are provided in Europe, “where regulators are clearly paying attention to this issue”, says Dr. Leonard Saltz, a co-author of the study.

To view the initial outline, Cause Map and proposed solutions, please click on “Download PDF” above.  Click here to view the study and drug waste calculator.

Hospital pays hackers ransom of 40 bitcoins to release medical records

By Kim Smiley

In February 2016, Hollywood Presbyterian Medical Center’s computer network was hit with a cyberattack.  The hackers took over the computer system, blocking access to medical records and email, and demanded ransom in return for restoring the system.  After days without access to their computer system, the hospital paid the hackers 40 bitcoins, worth about $17,000, in ransom and regained control of the network.

A Cause Map, an intuitive visual format for performing a root cause analysis, can be built to analyze this incident.  Not all of the information from the investigation has been released to the public, but an initial Cause Map can be created to capture what is now known.  As more information is available, the Cause Map can easily be expanded to incorporate it.

The first step in the Cause Mapping process is to fill in an Outline with the basic background information.  The bottom portion of the Outline has a place to list the impacts to the goals.  In this incident, as with most, more than one goal was impacted.  The patient safety goal was impacted because patient care was potentially disrupted because the hospital was unable to access medical records.  The economic goal was also impacted because the hospital paid about $17,000 to the hackers.  The fact that the hackers got away with the crime could be considered an impact to the compliance goal.  To view a filled-in Outline as well as a high level Cause Map, click on “Download PDF” above.

Once the Outline is completed, defining the problem, the next step is to build the Cause Map to analyze the issue. The Cause Map is built by asking “why” questions and laying out the answers to show all the cause-and-effect relationships that contributed to an issue.  In this example, the hospital paid ransom to hackers because they were unable to access their medical records.  This occurred because the hospital used electronic medical records, hackers blocked access to them and there was no back-up of the information.  (When more than one cause contributed to an effect, the causes are listed vertically on the Cause Map and separated with an “and”.)

How the hackers were able to gain access to the network hasn’t been released, but generally these types of ransomware attacks start by the hacker sending what seems to be routine email with an attached file such as a Word document. If somebody enables content on the attachment, the virus can access the system. Once the system is infected, the data on it is encrypted and the user is told that they need to pay the hackers to gain access to the encryption key that will unlock the system. Once the system has been locked up by ransomware, it can be very difficult to gain access of the data again unless the ransom is paid.  Unless a system is designed with robust back-ups, the only choices are likely to be to pay the ransom or lose the data.

The best way to deal with these types of attacks is to prevent them. Do not click on unknown links or attachments.  Good firewalls and anti-virus software may help if a person does click on something suspicious, but it can’t always prevent infection.  Many experts are concerned about the precedent set by businesses choosing to pay the ransom and fear these attacks may become increasingly common as they prove effective.

Patient death after ambulance delayed due to “extreme demand”

By ThinkReliability Staff

An inquest into the death of a young patient in London after a significant delay in the arrival of an ambulance released some disturbing details into the emergency process. We can perform a root cause analysis of the issues that led to the delay, and death, by capturing cause-and-effect relationships in a visual Cause Map.   As with many complex incidents, it will be helpful to capture the chronology of an event within a timeline. This timeline should not be confused with an analysis, but can be useful in organizing information related to the incident.

In this case, the patient, who had type 1 diabetes and had been feeling sick for more than a day, asked a friend to call an ambulance at about 5:00 pm on September 7, 2015. The friend dialed 111, which is the non-emergency medical helpline from the National Health Service. The initial call handler determined that the situation was not an emergency, but marked it for a 20-minute follow-up with a clinician. A clinical supervisor called back and spoke to the patient at 5:42 pm. She determined that it was an emergency that required an ambulance within 30 minutes. However, because it was known that the ambulance service was delayed, she asked the patient if she could get a friend to drive her to the hospital. The patient said she preferred an ambulance.

At this point it appears there was no contact until 10:15 pm, at which point a call-back was made to check on the patient’s ongoing symptoms. The friend at this time found the patient unconscious, having suffered cardiac arrest, and called 999, the emergency call system, at 10:23 pm. The ambulance arrived at 10:30 pm and took the patient to a hospital, where she died 5 days later.

At the inquest, the coroner testified that if the patient “had received definitive hospital care before she suffered a cardiac arrest in the evening of September 7, the likelihood is she would have survived.” Thus, from the perspective of the National Health Service, the patient safety goal is impacted because a death occurred that was believed to be at least partially due to an ambulance delay. Additional goals impacted are the patient services goal because of the delayed emergency treatment (the stated goal for the patient’s medical condition was 30 minutes, whereas the ambulance arrived nearly 4 hours after that goal). The schedule and operations goal is also impacted due to the insufficient capacity of both ambulances and the call system.

The Cause Mapping begins with an impacted goal and develops cause-and-effect relationships by asking “why” questions. The patient death was due to diabetic ketoacidosis, a severe complication of type 1 diabetes that may have resulted from an additional illness or underlying condition. As stated by the coroner, the delayed emergency treatment also resulted in the patient’s death. The ambulance that would take the patient to the hospital was delayed because the demand exceeded capacity. Demand was “extreme” (there were 200 other patients waiting for ambulances in London at the same time). The lack of capacity resulted from low operational resourcing, though no other information was available about what caused this. (This is a question that should be addressed by the service’s internal investigation.)

The patient was not driven to the hospital, which would potentially have gotten her treated faster and maybe even saved her life. The patient requested an ambulance and the potentially significant delay time was not discussed with the friend who had originally called. At the time of the first call-back, the estimated arrival time of an ambulance was not known. (By the time of the second call-back, it was too late.)

The second call-back was also delayed. Presumably this call was to update the patient’s symptoms as necessary and reclassify the call (to be more or less urgent) as appropriate. However, the demand exceeded supply for the call center as well as for ambulances. The call center received 300 calls during the hour of the initial call regarding this patient, which resulted in the service operations being upgraded to “purple-enhanced”. (This is the third-most serious category, the most serious being “black” or “catastrophic”.)   The change in operations meant that personnel normally assigned to call-backs were instead assigned to take initial emergency calls. Additionally, it’s likely the same “operational resourcing” issues that affected ambulance availability also impacted the call center.

Additional details of the causes related to the insufficient capacity of emergency medical services are required to come up with effective solutions. The ambulance service has completed its own internal investigation, which was presented to the family of the patient. The patient’s brother says, “I hope these lessons will be learnt and this case will not happen again” and the family says they will continue to raise awareness of the dangers of diabetes.

To view the initial analysis of this issue, including the timeline, click on “Download PDF” above. Or click here to read more.

more.

Study finds many patients don’t understand their discharge instructions

By Kim Smiley 

Keeping patients as comfortable and safe as possible following hospitalization is difficult if they aren’t receiving appropriate follow-up care after returning home.  But a recent study “Readability of discharge summaries: with what level of information are we dismissing our patients?” found that many patients struggle to understand their follow-up care instructions after leaving the hospital.  

Generally, follow-up care instructions are verbally explained to patients prior to discharge, but many find it difficult to remember all the necessary information once they return home.  The stress of the hospitalization, memory-clouding medication, injuries that may affect memory and the sheer number of instructions can make remembering the details of verbal follow-up care instructions difficult. 

In order to help patients understand and remember their recommended discharge instructions, written instructions are provided at the time of discharge.  However, the study found that many patients cannot understand their written follow-up care instructions.  The study determined that a significant percentage of patients are either functionally illiterate or marginally literate and lack the reading skills necessary to understand their written instructions.  One assessment found that follow-up care instructions were written at about a 10th grade level and another assessment determined that the instructions should be understood by 13 to 15-year-old students.  

One of the causes that contributes to this problem is that discharge instructions are written with two audiences in mind – the patient and their family as well as their doctor.  Many patients need simple, clear instructions, but other doctors understand medical jargon and more complicated care instructions.  

It is important to note that the study did have several limitations.  Researchers did not give patients reading tests and instead relied on the highest level of education attained to estimate literacy skills.  Non-English speakers were excluded.  Even with this limitation, the study provided information that should help medical professionals provide clear guidance on follow-up care recommendations. 

The obvious solution is to work towards writing care instructions that are as simple and clear to understand as possible. In order to help patients clearly understand their follow-up care instructions, the American Medical Association already recommends that health information be written at a sixth grade reading level.  Providing clear contact information and encouraging patients to call their nurse or doctor with any questions about discharge instructions could also improve the follow-up care patients are receiving.